Chart: Generate Chart from Grid Data
Tag: Chart
The Chart function generates charts from the grid.
| Attributes | Attribute Values | Value Description |
|---|---|---|
| Target | N/A | Grid code name |
| FilePath | N/A | XML file path containing the chart setup |
| KeepAlive | True / False | N/A |
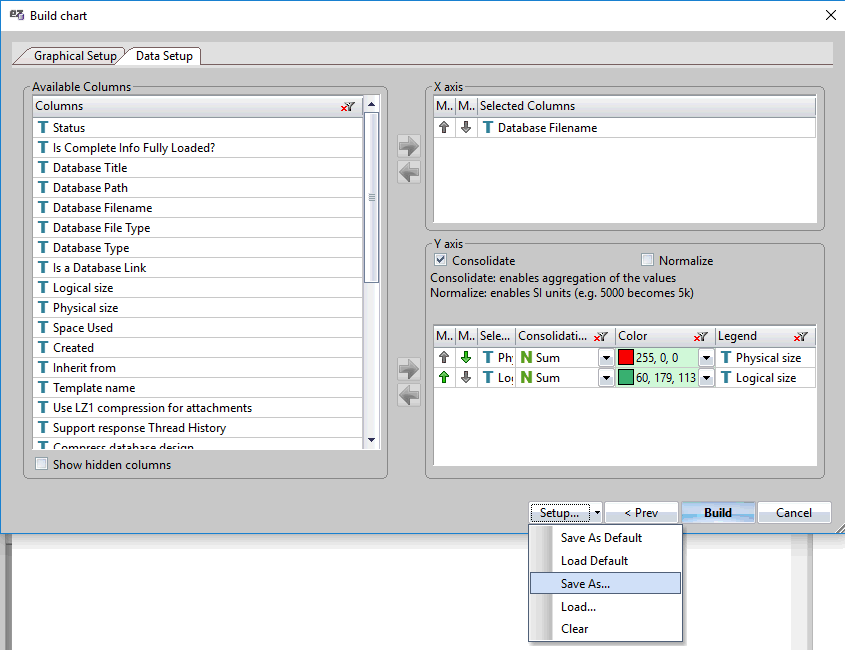
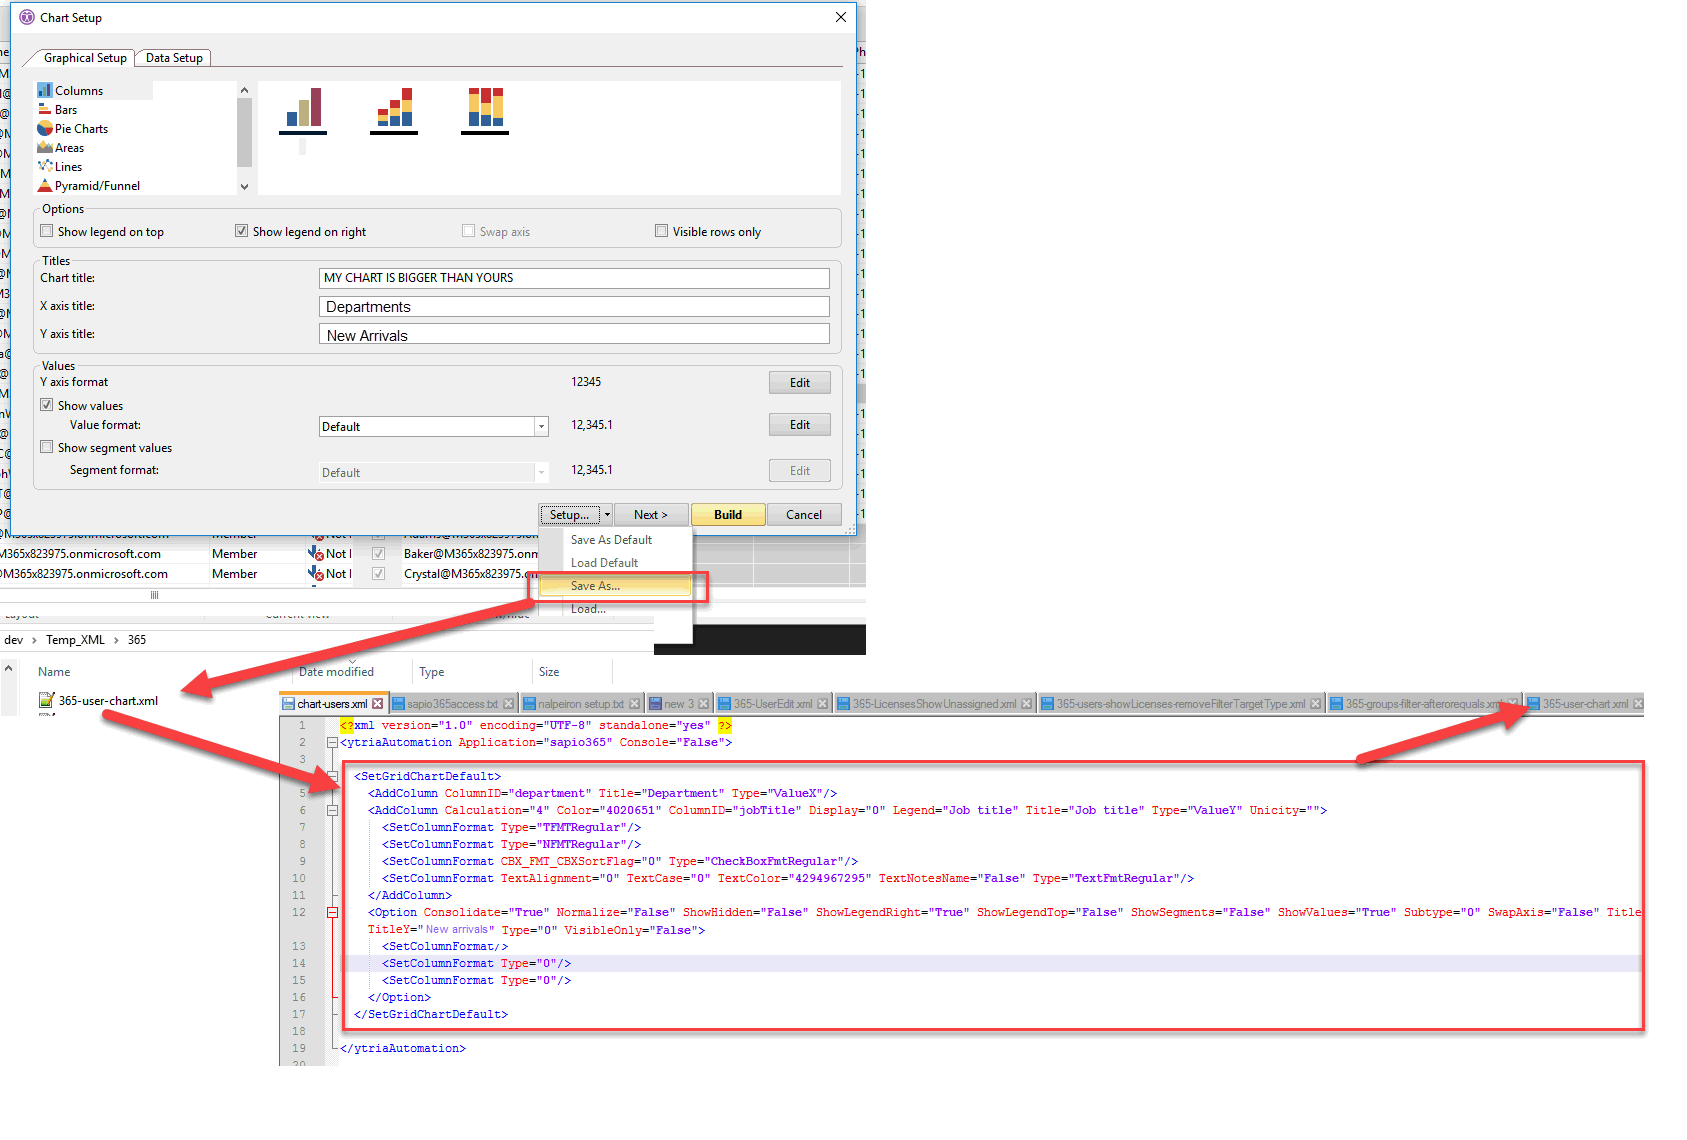
The chart setup dialog is not automated item per item. Instead, an XML setup file generated by Save As... must be used as the value of FilePath (or via automation recording):
<Chart FilePath="C:\dev\Temp_XML\databaseEZ-chart-20_04_2017_16_47_15-Chart.XML"/>SetParam Options
| Field | Values |
|---|---|
| FilePath | Target image file to save the chart into |
| Copy | "Click": copy image bitmap to clipboard |

Detailed Description
To save the chart to an image file, two options are available:
1. The above SetParam
<Chart FilePath="C:\dev\Temp_XML\databaseEZ-chart-20_04_2017_16_57_34-Chart.XML">
	<SetParam Field="FilePath" Value="C:\dev\Temp_XML\png chart exports\666.png"/>
</Chart>
2. The Export action:
<Chart FilePath="C:\dev\Temp_XML\databaseEZ-chart-20_04_2017_16_57_34-Chart.XML">
	<Export FilePath="C:\dev\Temp_XML\png chart exports\666.png"/>
</Chart>
To copy to clipboard, two options are available:
1. The above SetParam
<Chart FilePath="C:\dev\Temp_XML\databaseEZ-chart-20_04_2017_16_57_34-Chart.XML">
	<SetParam Field="Copy" Value="Click"/>
</Chart>
2. The CopyToClipboard action:
<Chart FilePath="C:\dev\Temp_XML\databaseEZ-chart-20_04_2017_16_57_34-Chart.XML">
	<CopyToClipboard/>
</Chart>
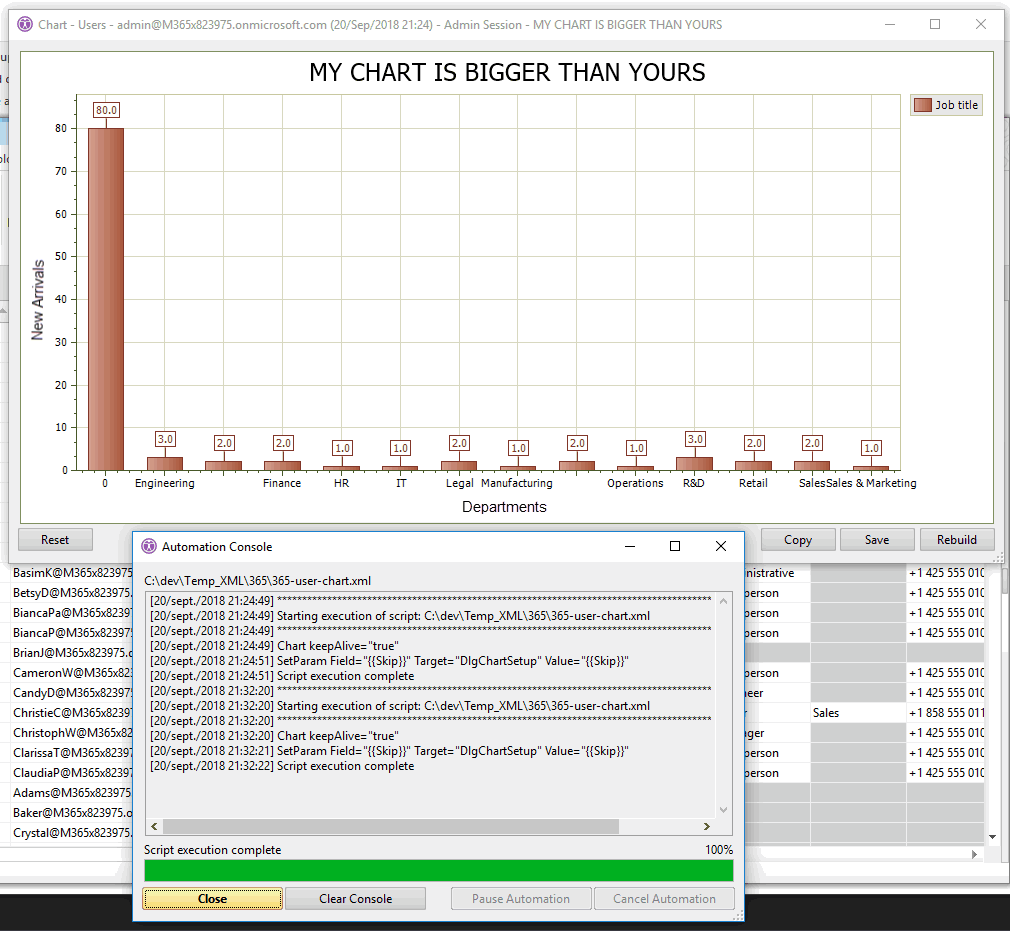
The chart dialog automatically closes, unless KeepAlive="true" is set. In consoleEZ, as with other grid automation, the Server and Index parameters must be used:
<Chart FilePath="C:\dev\Temp_XML\databaseEZ-chart-20_04_2017_16_47_15-Chart.XML"Server="MAINR5/YTRIA,NOTESAPP/YTRIA" index="1"/>
NEW v. 18 - LOAD CHART SETUP IN SCRIPT
Tag: SetGridChartDefault
Copy and paste the content of a chart setup XML file generated by the chart setup dialog into your own script::
Example Script
<ytriaAutomation Application="sapio365">
	<!--Chart FilePath="C:\dev\Temp_XML\365\chart-users.xml" keepAlive="true"/-->
	<Chart keepAlive="true">
		<SetGridChartDefault>
			<AddColumn ColumnID="department" Title="Department" Type="ValueX"/>
				<AddColumn Calculation="4" Color="4020651" ColumnID="jobTitle" Display="0" Legend="Job title" Title="Job title" Type="ValueY" Unicity="">
				<SetColumnFormat Type="TFMTRegular"/>
				<SetColumnFormat Type="NFMTRegular"/>
				<SetColumnFormat CBX_FMT_CBXSortFlag="0" Type="CheckBoxFmtRegular"/>
				<SetColumnFormat TextAlignment="0" TextCase="0" TextColor="4294967295" TextNotesName="False" Type="TextFmtRegular"/>
			</AddColumn>
			<Option Consolidate="True" Normalize="False" ShowHidden="False" ShowLegendRight="True" ShowLegendTop="False" ShowSegments="False" ShowValues="True" Subtype="0" SwapAxis="False" Title="MY CHART IS BIGGER THAN YOURS"
			TitleX="Departments" TitleY="New arrivals" Type="0" VisibleOnly="False">
				<SetColumnFormat/>
				<SetColumnFormat Type="0"/>
				<SetColumnFormat Type="0"/>
			</Option>
		</SetGridChartDefault>
	</Chart>
</ytriaAutomation>
This is equivalent to:
<Chart FilePath="C:\dev\Temp_XML\365\chart-users.xml" keepAlive="true"/>
