
Tag: ShowColumnStatistics
The ShowColumnStatistics function shows statistical data from columns in the grid.
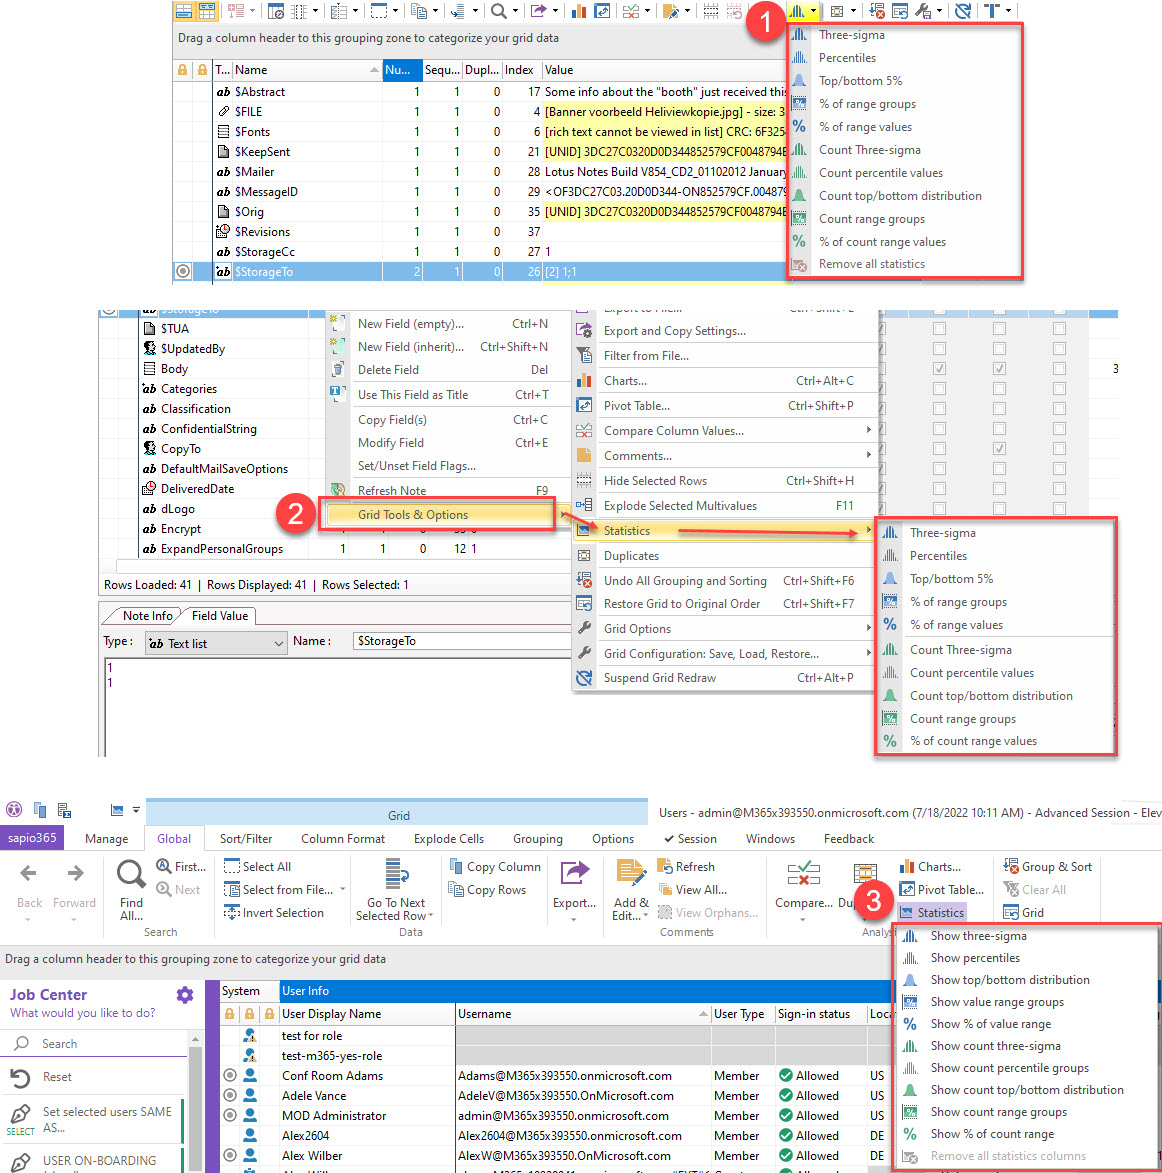
These columns are added through from the grid menu (EZ Suite products) (1), from the right-click menu (2) or from the Global tab of the ribbon (sapio365) (3).
Tag Attributes
|
Attributes |
Value Description |
|---|---|
|
Target |
Identifies the grid by name
|
|
Type |
Stats type identified by number:
|
|
ColumnID |
Column ID shows the columns if they're not visible. It selects the column like <SelectColumn ColumnID="..."/> |
Example Scripts
<ShowColumnStatistics Type="02"/>
A column must be selected
<ytriaAutomation>
	<ShowMyDataDrivel>
		<!--SelectColumn ColumnID="SIZE"/-->
		<ShowColumnStatistics Type="02" ColumnID="SIZE"/>
	</ShowMyDataDrive>
</ytriaAutomation>