Tag: ReportData
The ReportData function injects data from an Automation Data Source to the Business Report that runs it.
NB: this function is useless outside of a Business Report and ends in error if used out of this context.
Data structures that can be generated and injected into the report:
-
Number (plain number or percentage, with or without link)
-
Table
-
Chart
Table and Chart types use automation SetVar lists to send the data to the Business Report.
List entries that are not with the action type SetVar will produce no data.
In the HBS Business Report file, an automation data source is used with the same syntax as the other data source types (graph filters or built-in):
<p>The automation LIST chart</p>
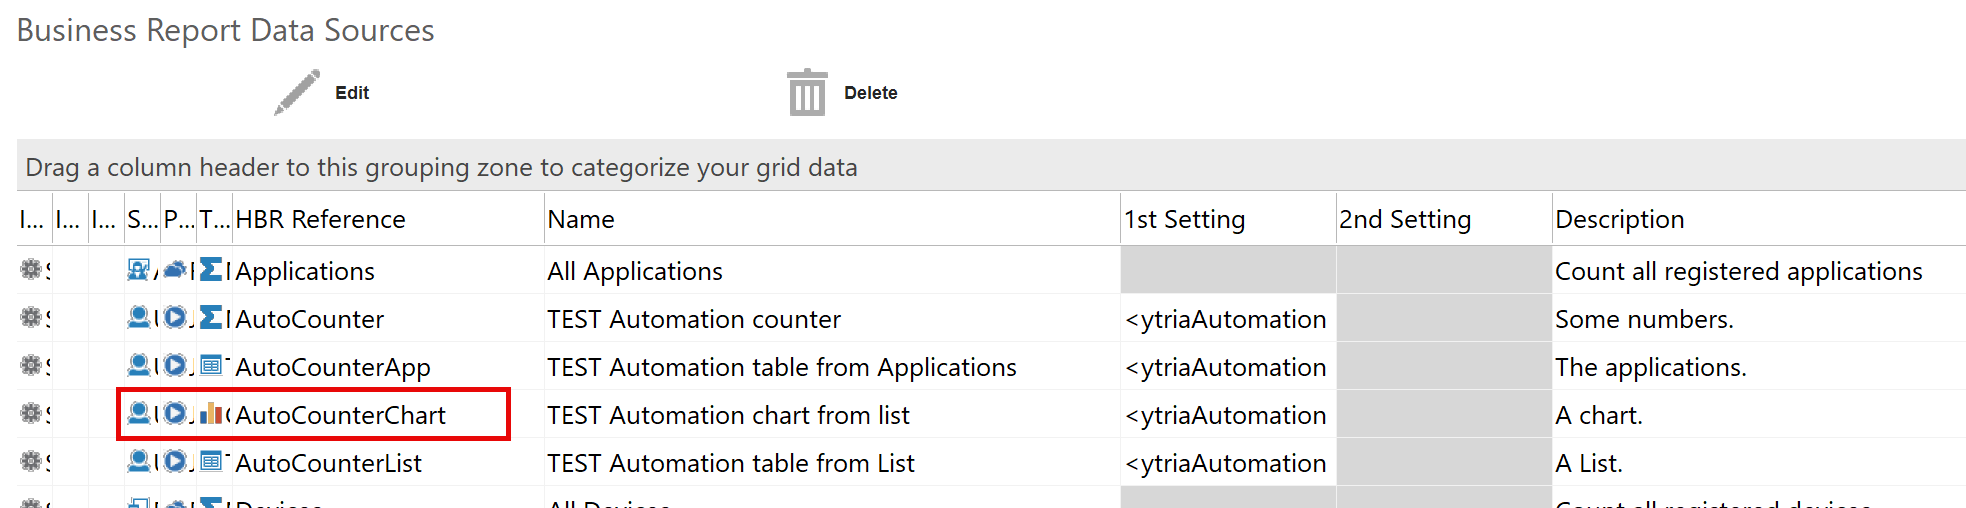
<p>{{{chart 'AutoCounterChart' 'class2'}}}</p>
The content of an automation data source is a regular, fully formed automation script, that includes a call to ReportData.
A data source script that does not include ReportData sends nothing to the Business Report, which then displays an error.
If a data source script includes several calls to ReportData, only the data from the last call ends up being used in the Business Report.
Tag Attributes for Number
|
Attributes |
Value Description |
|---|---|
|
Val |
Value - required |
|
Total |
Total (for percentage) |
|
Url |
link |
<ytriaAutomation Application="sapio365" console="false">

... things happen ...
	<SetVar BRval="99" BRtotal="100"/>

	<ReportData val="{%BRval%}" total="{%BRtotal%}"/>

</ytriaAutomation>
Usage in Business Report HBS file:
<p>AUTOMATION counter: {{{AutoCounter.val}}} </p>
<p>AUTOMATION %: {{{percentage 'AutoCounter' 'class4'}}} </p>
<p>AUTOMATION link: {{{link 'AutoCounter' 'ytria://… '}}} </p>
Tag Attributes for Table
|
Attributes |
Value Description |
|---|---|
|
Caption |
Table caption |
|
Rows |
Name of list containing the data set - required |
|
<table column headers> |
Text to display as column headers. The parameter names must match the list variable names that contain the data. |
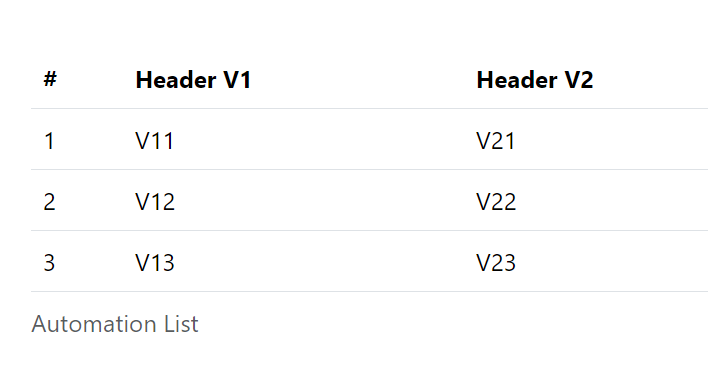
In this example, we create a 2 columns table from the list named AutoBRDS. Column headers are linked from to the list entries using matching variable names:
<ytriaAutomation Application="sapio365" console="false">

	<List Name="AutoBRDS" Action="SetVar" V1="V11" V2="V21"/>
	<List Name="AutoBRDS" Action="SetVar" V1="V12" V2="V24"/>
	<List Name="AutoBRDS" Action="SetVar" V1="V13" V2="V23"/>

	<ReportData caption="Automation List" Rows="AutoBRDS" V1="Header V1" V2="Header V2" />

</ytriaAutomation>
Result in BR:
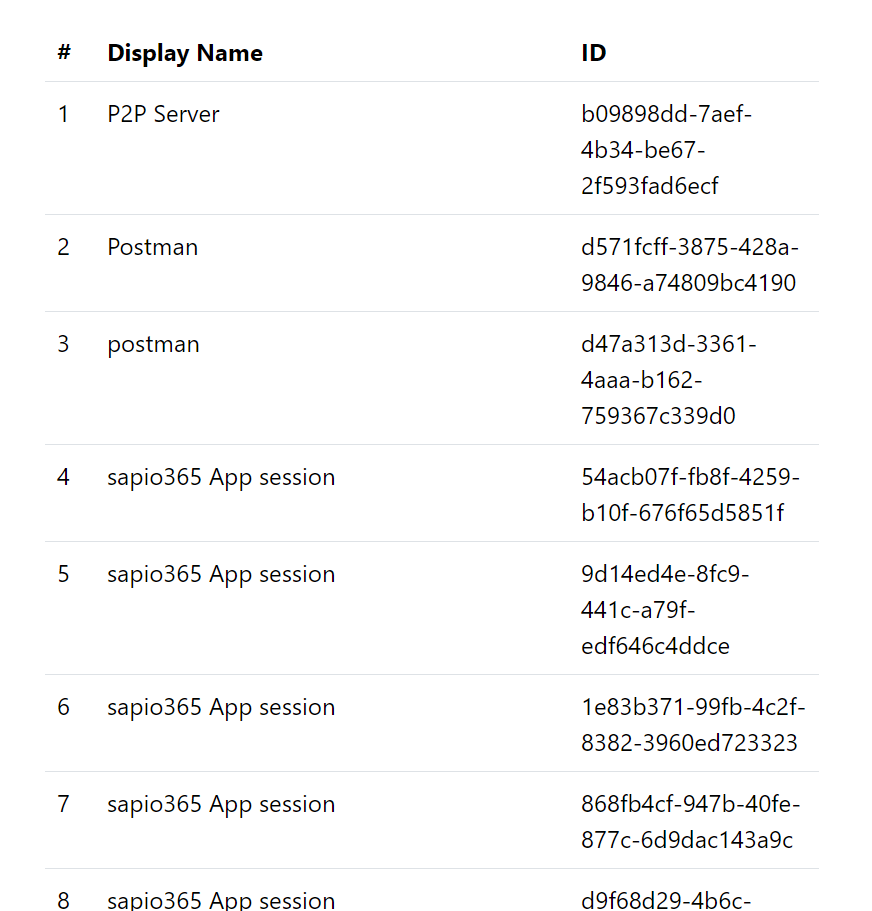
In this example, the list is generated from the grid in the Applications module, using SetVarListFromGridSelection:
<ytriaAutomation Application="sapio365" console="false">

	<ShowApplications keepalive="false">
		<Select lines="all"/>
		<SetVarListFromGridSelection ListName="AppList" v1_AppName="displayName" v2_AppId="appId" OrderAscBy="v1_AppName"/>
	</ShowApplications>

	<ReportData caption="Registered Applications" Rows="AppList" v1_AppName="Display Name" v2_AppId="ID" />

</ytriaAutomation>
Result in BR:
Tag Attributes for Chart
|
Attributes |
Value Description |
|---|---|
|
Datasets |
Name of list containing the chart data - required |
|
<chart legend labels> |
Text to display on the Y axis as column legends for each data set. The parameter names must match the list variable names that contain the data. |
|
Label for list entries |
Text variable in each list entry to identify the labels on the X axis. |
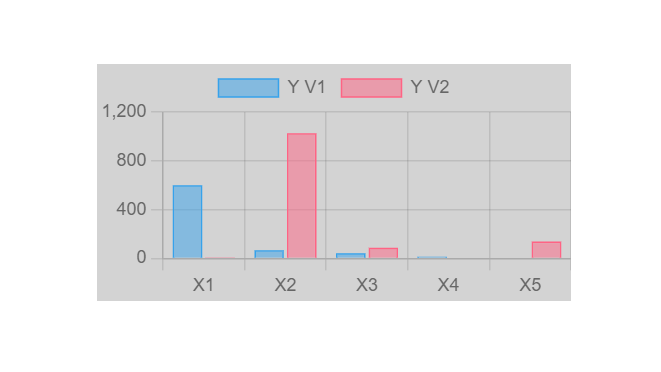
In this example, we create a chart with two sets of data V1 and V2:
<ytriaAutomation Application="sapio365" console="false">

	<List Name="AutoBRDS" Action="SetVar" V1="600" V2="3" label="X1"/>
	<List Name="AutoBRDS" Action="SetVar" V1="66" V2="1025" label="X2"/>
	<List Name="AutoBRDS" Action="SetVar" V1="42" V2="88" label="X3"/>
	<List Name="AutoBRDS" Action="SetVar" V1="13" label="X4"/>
	<List Name="AutoBRDS" Action="SetVar" V2="138" label="X5"/>

	<ReportData datasets="AutoBRDS" V1="Y V1" V2="Y V2"/>

</ytriaAutomation>
Result in BR: