
replicationEZ helps you analyze replication events information in log.nsf files for one or more servers and then sort, filter or chart this information. You have the choice of displaying this data in a flat view (standard Ytria grid) or a pivot table.
|
NOTE |
If the "Log_Replication=n" entry in a server's notes.ini file is missing or set to "0", there will be no replication events log information to display. Click here to consult the IBM Domino Administrator Help page on the Log_Replication notes.ini entry. |
|---|
How to analyze logs
In order use the Log Analyzer tool, click Log Analyzer in the tools menu. After this you'll be prompted to choose server or servers for log analysis. Only servers currently open in replicationEZ will be listed.
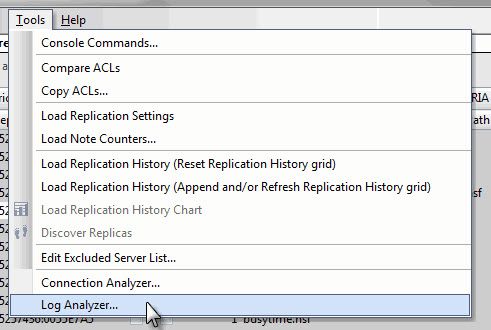
Access the Log Analyzer from the Tool menu
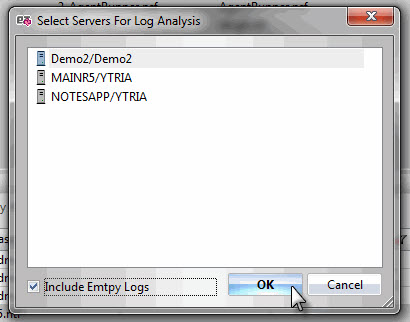
You can choose from which servers to retrieve logs
Configuring the Log Analyzer
After you choose the server or servers for log analysis, the Choose Columns dialog will appear. Here you can choose between a 'flat view' (normal grid-type display) or a 'pivot view' (which is akin to a pivot table in a spreadsheet application).
For the Flat View you must choose from the list of available columns:
-
Selected Server
-
Note ID
-
IN
-
OUT
-
Start Time
-
End Time
-
Initiated By
-
Path Name
-
Remove Server
-
Target
-
Target Database
-
Source
-
Source Database
-
Direction
-
Accessed
-
Added
-
Deleted
-
Updated
-
Received
-
Sent
-
Port
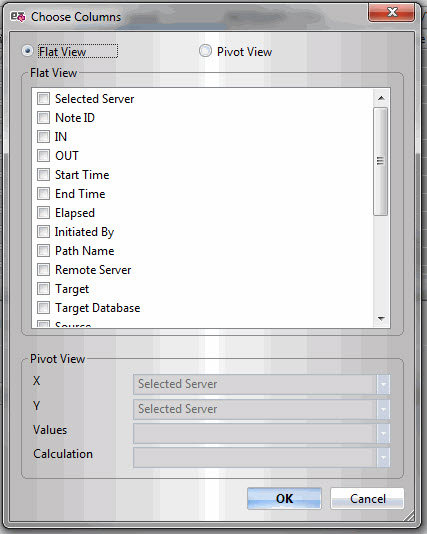
The Choose Columns dialog is the first step in setting up your Log Analyzer panel
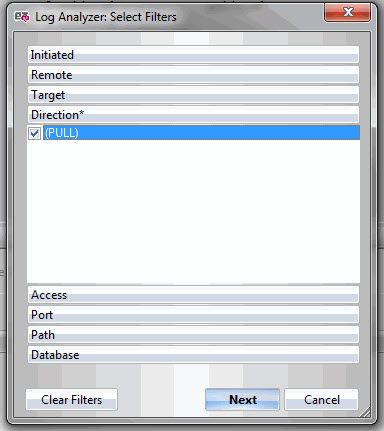
You'll also be prompted to select filters with this dialog (optional)
A progress bar will appear while replicationEZ retrieves logs and builds the display
The Log Analyzer Panel
Once you've chosen the columns and the type of view you wish to use (and set any filters), the information is displayed in the Log Analyzer panel. If you opt for the 'Flat View,' it uses a grid-type inferface which offers the standard grouping, filtering, customization and exportation options available in all Ytria tools' grids.
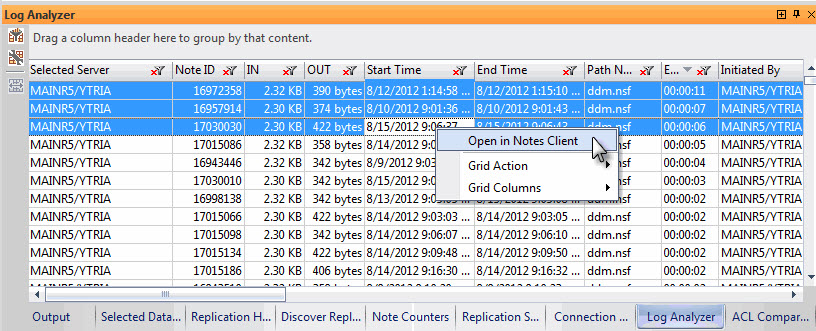
This is an example of a Flat View being used in the Log Analyzer
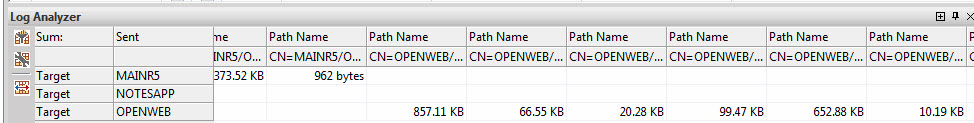
This is an example of Pivot table view (X = "path name; Y = "target"; Values = "sent"; Calculation = "Sum")
Right-click menu options in the Log Analyzer panel
The right-click contextual menu is only available when using the Flat View. Here are the available options:
Open in Notes Client
Grid Action: Here you'll find standard exportation, customization and filtering available in all Ytria tools' grids. Click here to see an overview of global grid features
Grid Columns: This allows you to hide any of the columns available in this grid.
Buttons in the Log Analyzer panel
The following buttons provide additional options in this panel:

Select Filters: This re-opens the Select Filters dialog.

Grid Setup: This re-opens the Choose Columns dialog.

Grid Type: If applicable, this will toggle between pivot and flat (regular) style grids.