Information Research and Reporting
The first set of IT admin use cases include accessing and viewing data from a M365 tenant. These views include information from Users, Groups, Teams and SharePoint sites, plus details about the tenant.
Retrieving User and Group Information
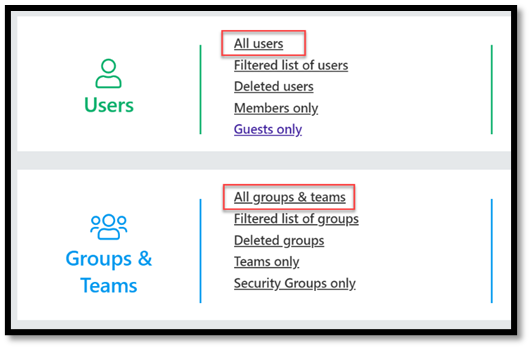
To create a view of information from your tenant you can start on the main screen and use one of the available click options from Users, Groups, SharePoint Sites, or your Tenant.
Once your data has been loaded, you will see a default view showing certain attributes or property columns in the grid.
Customizing a View within the Grid
Using views of information, or data attributes, within sapio365 Grid is very flexible and powerful. You can easily customize the information the way you want. Follow the different options in this subsection to try out the different options available to sort, filter, and group the information and create your very own custom views.
Sorting & Filtering
Alphabetical sorting and a quick filter are readily available within the data views. Extensive filter options are also provided for values, regular expression, text, number, date, time, cutoff date/time. Also provided are options to exclude empty cells, clear filters and hide selected rows.

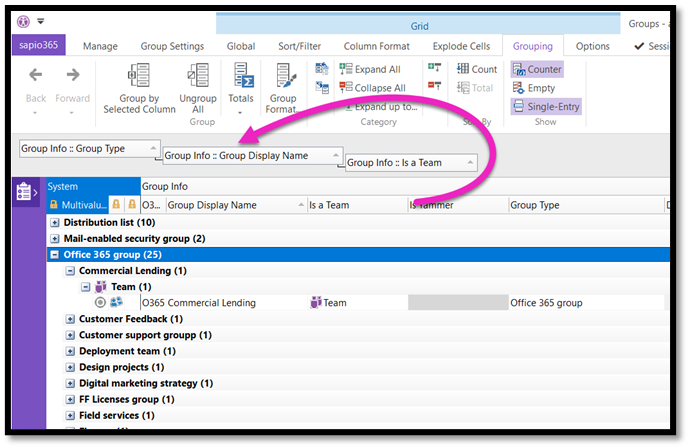
Grouping
Grouping is a special feature of the Flexy View Grid allowing you to categorize the entire grid by any property, on the fly. Simply drag any column headers up into the grouping zone.
Adding New Fields to the Data View
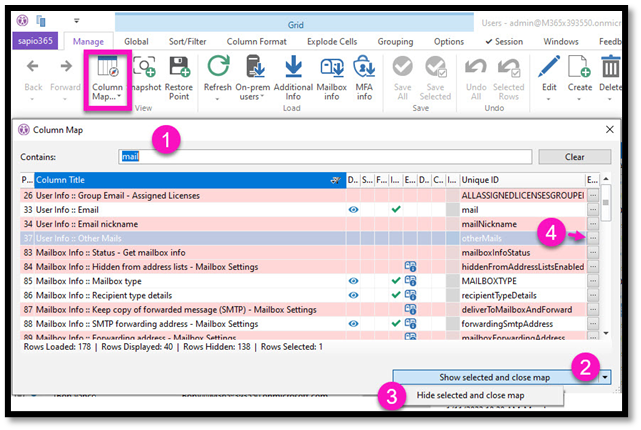
To include more information in your data view, you can use the Column Map which is accessible in the Manage tab or through the right-click menu Grid Options. It gives you a complete list of available properties and lets you get an overview of your current column setup (what is displayed vs what is not).
NOTE (see graphic example below):
Pink rows are hidden columns.
The eye icon indicates shown columns.
Double-click to show and go to grid: Show additional columns in the grid by double-clicking on one column or selecting several of them and using the button “Show selected and close map”. The focus will immediately jump to that column in the grid even if it is already present in the grid.
Double-click to show and go to grid: Show additional columns in the grid by double-clicking on one column or selecting several of them and using the button “Show selected and close map”. The focus will immediately jump to that column in the grid even if it is already present in the grid.
Hide from grid: Select displayed columns (white) and hide them with the submenu option “Hide selected and close map”.
Edit column settings: Change the width (column size), cell format or title. These changes are not sticky and will revert to the default configuration once the view is closed.
Saving a Data View for Future Use
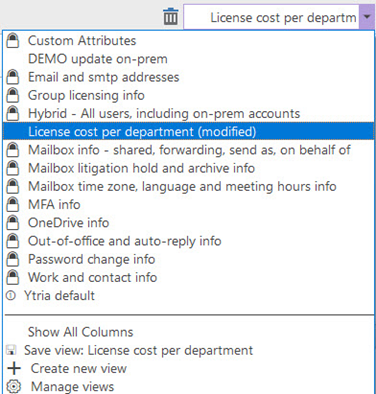
On the far upper-right side there is a drop-down menu allowing you to access and save data views.
Click on “Create new view”.
Add a name and description. Optional: set view as default.
See and confirm what’s configured in the view before saving it.
In the screenshot below, a new view is saved as “License cost per department”.

Your view is then listed in the dropdown menu. Create as many views as you need. If the list becomes longer than your display screen, a scroll bar will appear.
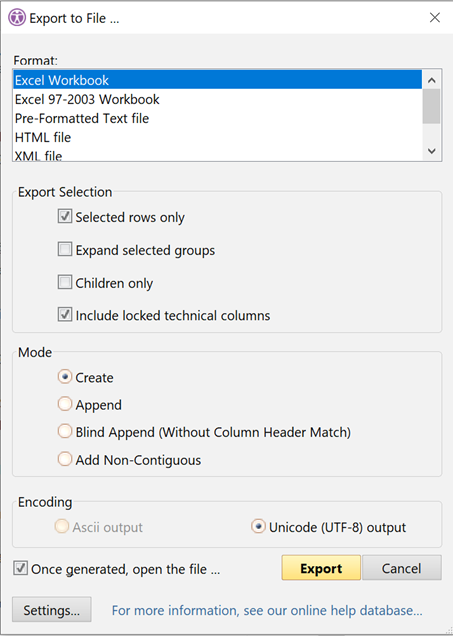
Exporting a Data View to Excel
From any data view you can easily export selected rows of information or the entire view. Simply navigate to the ‘Global’ tab in the ribbon and use the ‘Export to File…’ button. This will bring up a window like the one shown below and allow you to pick and choose what information to export to your file and the file type (i.e. Excel Workbook).