
The Connection Analyzer Chart
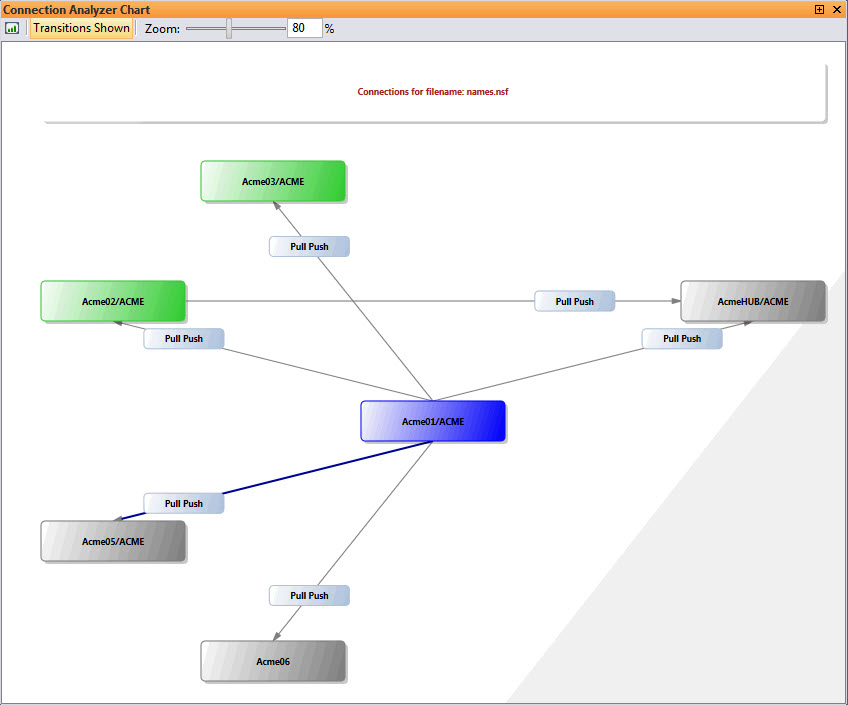
The Connection Analyzer Chart panel is used in conjunction with the Connection Analyzer grid to give you a visual representation of information from server connection documents.
How to use the Connection Analyzer Chart
In order to generate a chart, you must first run a connection analyzer scan (Tool > Connection Analyzer); you can run it on any server currently open in the Databases panel.
Once the scan is complete, just select a database row in the Connection Analyzer grid to generate a chart based on its connections.
Options in the Connection Analyzer Chart
The Replication History chart offers the options which follow:
-
Export Chart

-
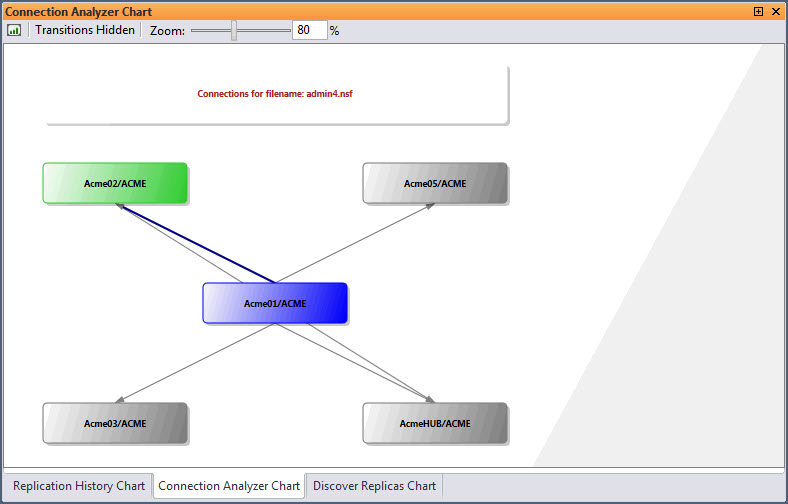
Transitions Shown / Hidden: When this button is set to Transitions Hidden, then Pull Push nodes will not be shown (as in the image below).
-
Zoom: For a better view or organization, it is possible zoom on the chart from 1% to 1000%.
Colors in the Connection Analyzer Chart
Server Node Colors
|
Color |
Description |
|
|
This color indicates that this server was selected during the Connection Analyzer scan. |
|
|
This color indicates when a server is currently loaded in the back-end of the application. |
|
|
This color indicates that a server is NOT currently loaded in the back-end of the application. |
|
|
This color indicates that a server is currently loaded in the back-end of the application, but is part of the Excluded Server List. |


Transition Arrow Colors
|
Color |
Description |
|
|
Default color for transition arrows. |
|
|
This color indicates the main transition (i.e. the transition that represented the line selected in the Connection Analyzer grid). |

