
How to open Log Analyzers in consoleEZ
-
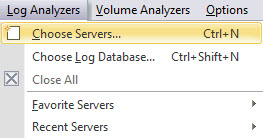
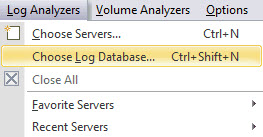
Use the Choose Servers command in the Log Analyzers menu (Ctrl + N).
-
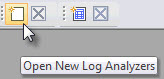
Click Open New Log Analyzers in the Log Analyzer actions toolbar.
You'll be prompted to select one or more server(s). More information about the Choose Servers window on this page.
|
NOTE |
If you load more than one Log Analyzer, the header of the Log Analyzer Options will display the list of the selected consoles.
|
|---|
-
Use Choose Log Database in the Log Analyzers menu (Ctrl + Shift + N).
You'll be prompted to select a database. More information about the Select Database window on this page.
-
Use your Favorite Servers list in the Log Analyzers menu.
-
Use the Recent Servers list.
|
NOTE |
The Recent Servers List is populated with the Windows Registry in HKEY_CURRENT_USER\Software\Ytria\Settings\All\RecentServers |
|---|
How to open Log Analyzers in consoleEZ Dashboard
-
Use Launch Log Analyzer for the Selected Servers in the toolbar icons.
-
Use the Dashboard right-click option to open a Log Analyzer on your selection of servers.
-
Use the Launch Log Analyzer around selected Error Event right-click option on the Selected Error List grid.
|
NOTE |
The Date-Time Range Filter will be set 30 minutes after the selected error.
|
|---|
How to open Log Analyzers using Ytria Automation
As most of Ytria Products, consoleEZ uses Automation, you can use it to automatically open your Log Analyzers.
To do so, go to File > Load Automation XML (Ctrl + X).
More information about Choose Servers automation here.