
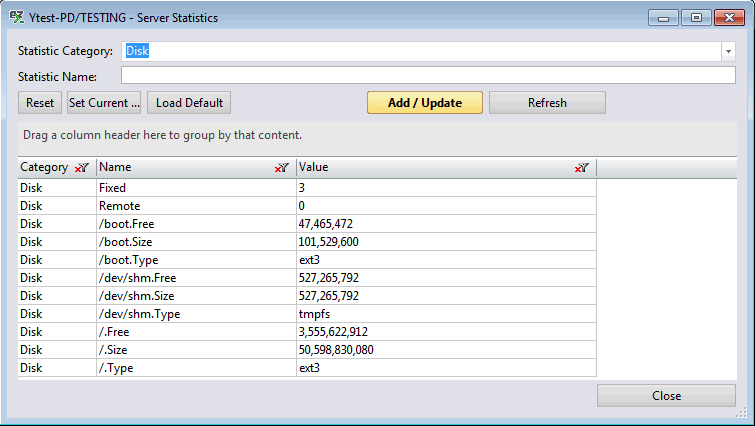
consoleEZ Server Statistics
This function displays the list of the server statistics running on your Domino Server.
They are identified by Statistic Category, Statistic Name and Value.
consoleEZ Server Statistics
Open Server Statistics
-
In consoleEZ:
Use the toolbar's Console icon, to open the current server console statistics.

-
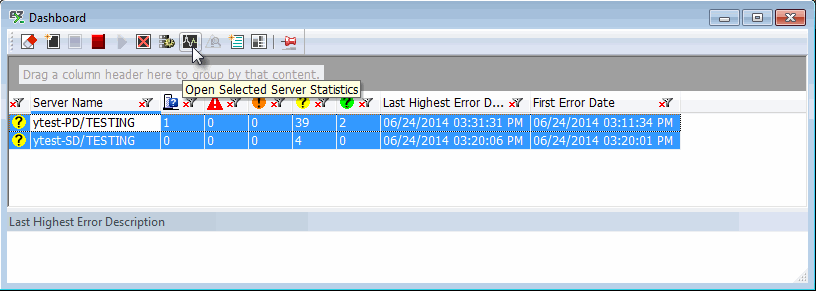
In consoleEZ's Dashboard:
Use the toolbar's Dashboard icon to open the selected servers' statistics.
-
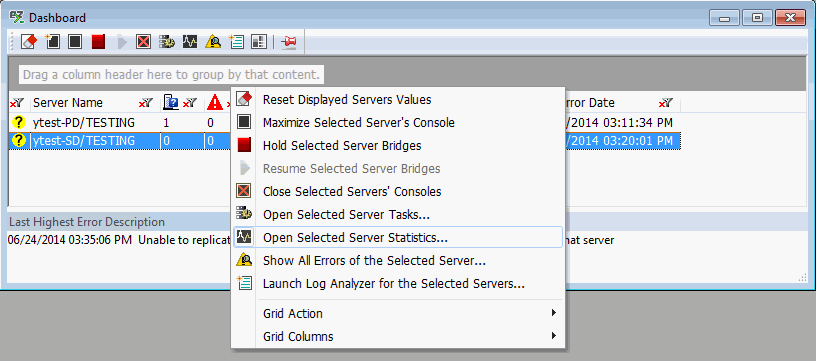
In consoleEZ's Dashboard right-click options:
Use the toolbar's Dashboard right-click options to open the selected servers' statistics.
Using Server Statistics
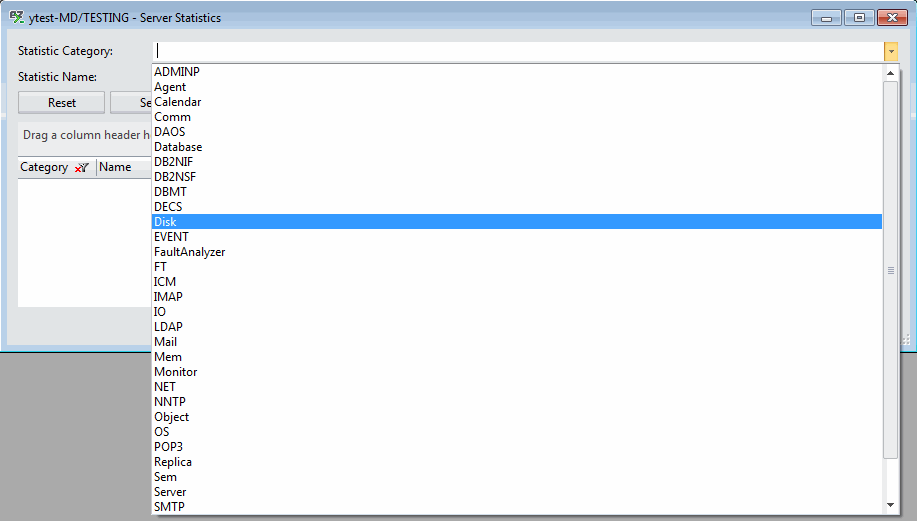
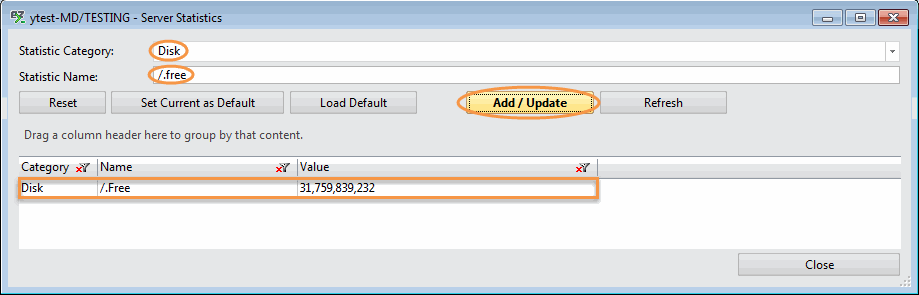
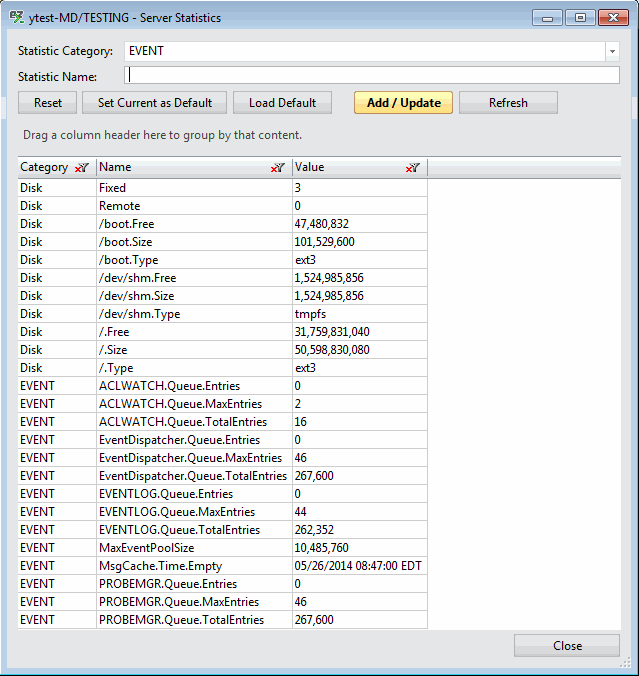
Choose the statistics you want to display from the pull-down list, or type it directly.
|
TIP |
If you leave your 'Stat Name' blank and click 'Add Value(s)', all the server statistics selected will be displayed in the grid. |
|---|
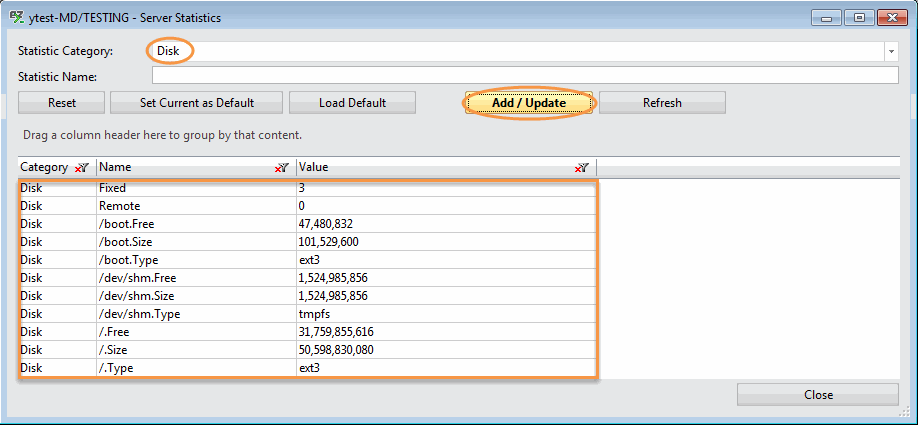
If you type a specific 'Sat Name' and click 'Add Value(s)', the grid will only display this statistic.
Server Statistics options
-
Reset: resets the grid
-
Set Current as Default: sets the current added values as default for all the Server Statistics windows.
-
Load Default: loads the default values to the grid.
|
TIP |
The Default Statistics are stored in the YtriaConsoleEZDefaultStatistics.txt file located in your Notes/data directory. |
|---|
-
Add / Update: adds or updates the selected statistic value and Stat Name in the grid.
-
Refresh: Refreshes the Server Bridge Stat Value data on the grid.
Grid right-click options - Tools and Columns
More information about Grid Tools and Options is here.
The Server Statistics Grid includes the following columns:
|
Category |
Statistic Category. |
|
Name |
Statistic Name. |
|
Value |
Statistic Value. |
More information about Grid Columns is here.