
consoleEZ Volume Analyzers
The Volume Analyzers in consoleEZ provides you with the Ytria flexYgrid interface.
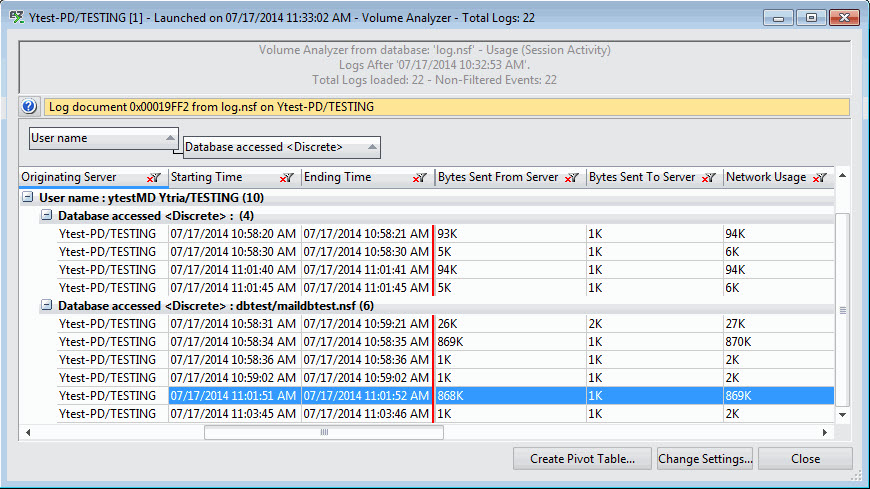
The Volume Analyzer scans the 'Events' categories from the server's log.nsf and displays the log's entire content.
Volume Analyzers Options
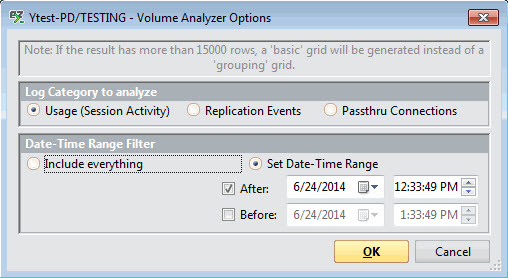
Log Category to analyze:
-
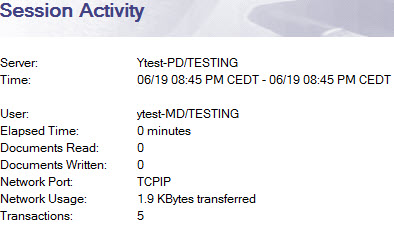
Usage (Session Activity): Session and network activity of users or servers on Databases and Domino servers.
-
Replications Events: Information about server replications.
-
Passthru Connections: Activity of users or servers connecting through a Domino pass-through connection.
|
TIP |
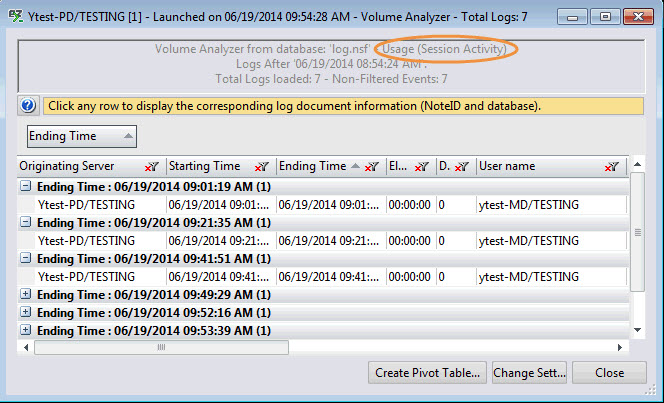
The type of Volume Analyzer launched is displayed in the grid's header.
|
|---|
Date-Time Range Filter:
-
Include everything: Includes all the logs; no time range is applied.
-
Set Date-Time Range: By default it takes 30 minutes before the last log time.
Using Volume Analyzers
-
Create Pivot Table: More information on this page.
-
Change Settings: Goes back to the Volume Analyzer Options window.
-
Close: Closes the Volume Analyzer grid.
Grid right-click options - Tools and Columns
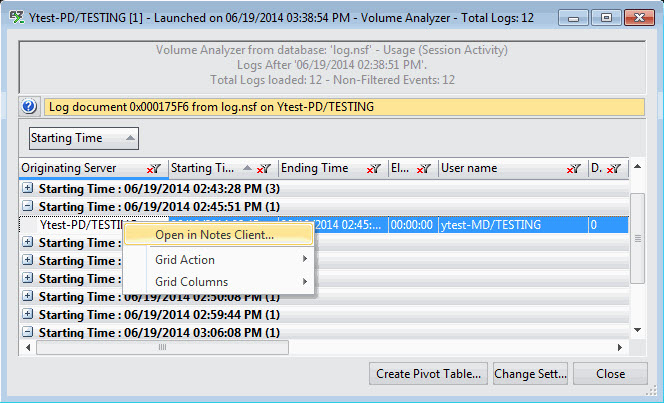
Open in Notes Client: Open the selected Volume Analyzer event in the Notes Client.
More information about Grid Tools and Options is here.
The Volume Analyzers grid includes the following columns:
Usage (Session Activity):
|
Originating Server |
Source server |
|
Starting Time |
Date and Time value |
|
Ending Time |
Date and Time value |
|
Elapsed Time |
Time value |
|
User Name |
User session activity |
|
Documents Read |
Number of documents read |
|
Documents Written |
Number of documents written |
|
Bytes Sent From Server |
Number of bytes sent from server |
|
Bytes Sent To Server |
Number of bytes sent to server |
|
Network Usage |
Session network usage |
|
Nb of Transactions |
Decimal value |
|
Discrete - Database accessed |
Name of the Database accessed |
|
Discrete - Documents Read |
Number of documents read on a database |
|
Discrete - Documents Written |
Number of documents written on a database |
|
Discrete - Time Opened (in Seconds) |
Duration of an opened database |
|
Discrete - Bytes Read |
Number of Bytes read on a database |
|
Discrete - Bytes Written |
Number of Bytes written on a database |
|
Discrete - Nb of Transactions |
Number of transactions on a database |
|
Number of Discrete Events |
Decimal value |
|
Log Document NoteID |
Hexadecimal format value |
Replication Events:
|
Originating Server |
Source replication server |
|
Starting Time |
Date and Time value |
|
Ending Time |
Date and Time value |
|
Elapsed Time |
Time value |
|
Initiated By |
Replication server initiator |
|
Remote Server |
Target replication server |
|
Discrete - Target Server |
Server replication command target |
|
Discrete - Target Database |
Database updated by replication process |
|
Discrete - Source Server |
Server replication command source |
|
Discrete - Source Database |
Source database sending information |
|
Discrete - Direction |
PUSH/PULL |
|
Discrete - Source Server Access |
Server replication command source - Access level |
|
Discrete - Note(s) Added |
Number of Note(s) added |
|
Discrete - Note(s) Deleted |
Number of Note(s) deleted |
|
Discrete - Note(s) Updated |
Number of Note(s) updated |
|
Discrete - Total Bytes Received |
Total number of bytes received during the replication |
|
Discrete - Total Bytes Sent |
Total number of bytes sent during the replication |
|
Number of Discrete Events |
Decimal value |
|
Log Document NoteID |
Hexadecimal format value |
Passthru Connections:
|
Originating Server |
Passthru server |
|
Starting Time |
Date and Time value |
|
Discrete - Date |
Date and Time value |
|
Discrete - Destination |
Destination server |
|
Discrete - User Name |
Name of the user using a Passthru connection |
|
Discrete - Error Description |
Connection error description |
|
Number of Discrete Events |
Decimal value |
|
Log Document NoteID |
Hexadecimal format value |
More information about Grid Columns is here.