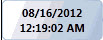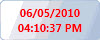
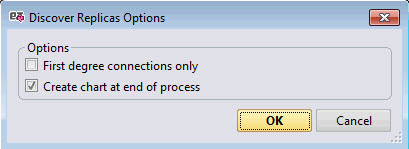
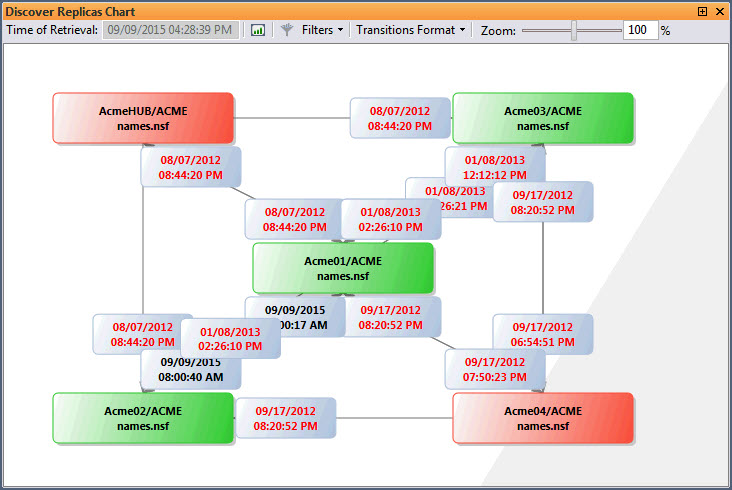
When performing a Discover Replicas operation with the option to Create chart at end of process, your results will be shown in both the Discover Replicas Panel and the Discover Replicas Chart.
How to use the Discover Replicas Chart
To populate the Discover Replicas Chart panel, you must first run a Discover Replicas scan.
You can perform these scans by selecting a database in either the main grid or the Replication History panel and choosing 'Discover Replicas' in the right-click menu.
More information about Discover Replicas here.
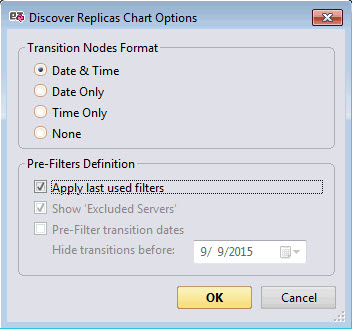
The setup dialog defines your chart parameters including;
- Date/Time to be displayed
- Apply current filters
- if 'Excluded Servers' have to be included or not
- if so, then which transition dates to handle
Once the chart has been generated, you will see your selected database mapped out along with its connections to other replicas. The Time of Retrieval will also be displayed at the top of the chart.
(See the color code legend below for information on how the colors will further explain the Discover Replicas scan results.)
Options in the Discover Replicas Chart
The Discover Replicas Chart offers the following options;
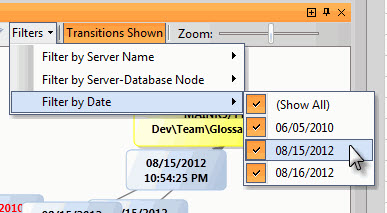
Chart Filters: Should you wish to simplify the display, these filters may be used to remove replicas from the chart.
-
Filter by Server Name.
-
Filter by Server Database Node.
-
Filter by Date
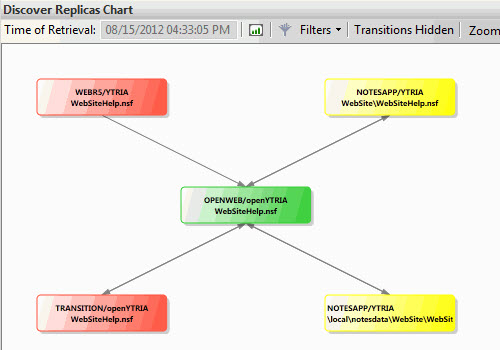
Transitions Shown/Hidden toggle button: When this button is set to Transitions Hidden, replication-time nodes will not be shown (as in the image below).
Buttons:
|
|
This button allows you to export the displayed Discover Replicas Chart as either a .bmp, .png, .jpg, .jpeg, .gif, or .tiff image file. |
|
|
Apply the options set in the Filters menu. |


Zoom: For a better view or organization, you can zoom on the chart from 1% to 1000%.
The Color code in the Discover Replicas Chart
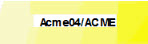
The database and transition nodes in the Discover Replicas Chart use the following color coding in order to provide more information:
Database Node Colors
|
Color |
Description |
|
|
Used to indicate when a server is currently loaded in the back-end of the application.
Databases Panel in a Partially Loaded Mode. |
|
|
Indicates that a server and database did not respond or we were unable to retrieve its 'Replication History'.
|
|
|
Used to indicate that a server is NOT currently loaded in the back-end of the application.
|
|
|
Used to indicate that a server is currently loaded in the back-end of the application but is part of the Excluded Server List.
|


Transition Node Text Colors
|
Color |
Description |
|
|
Default color for transition nodes. |
|
|
Used to indicate if the date shown in the transition is more than a month ago. |