The Replication History Chart
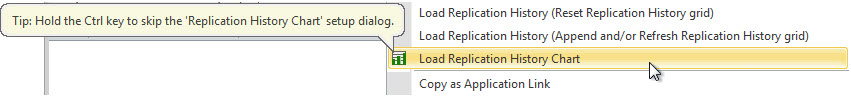
To generate a Replication History chart, right-click a database in the Main Grid and choose Load Replication History Chart from the right-click menu.
Alternatively, if you have databases loaded in the Replication History Panel, you can also right-click any of them and choose Load Replication History Chart from the contextual menu.
Next, the Replication History Chart Options dialog opens to let you customize or filter your chart. (The Options dialog is explained below).
To skip this dialog, hold the Ctrl key when you click on Load Replication History Chart .
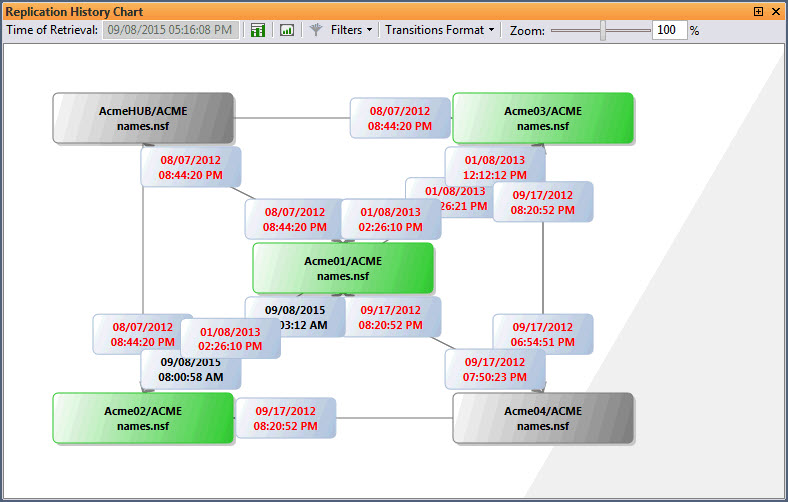
Once loaded, a chart will be displayed in the Replication History Chart panel.
Each large node represents a database replica; the smaller nodes are the transition (showing the date and time of the last replication); the lines represent the replication linkages between replicas.
Replication History Chart Options
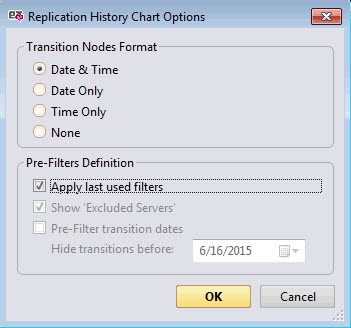
Transition Nodes Format: See the Transition Format button for more information.
Pre-Filters Definition:
-
Apply last used filters: Use the most recent Filters set on the chart. Selected by default.
-
Show 'Excluded Servers': Show or hide, in the chart, the server entered in the Excluded Server List. Selected by default.
-
Pre-Filter transition dates
Hide transition before: Select a date; every replication event before this date will be hidden.
Options in the Replication History Chart
The Replication History Chart offers the following options.
Time of Retrieval: Date and time at which the Replication History Chart was built.
Buttons:
|
|
This button will rebuild the Replication History Chart based on your current selection in the main grid. |
|
|
This button allows you to export the displayed Replication History chart as either a .bmp, .png, .jpg, .jpeg, .gif, or .tiff image file. |
|
|
Applies the options set in the Filters menu. |


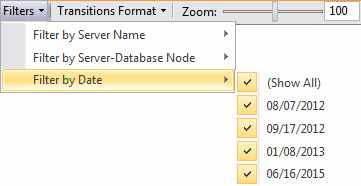
Filters:
-
Filter by Server Name:
Filter 'Excluded Servers': Show or hide the server listed in the Excluded Server List.
(Show All): If checked all the servers listed will be displayed on the chart.
'Server Name': Select the servers to be displayed or hidden.
-
Filter by Server-Database Node:
(Show All): If checked all the server nodes listed will be displayed on the chart.
'Server Name': Select the Server-Database nodes to be displayed or hidden.
-
Filter by Date:
(Show All): If checked all the dates listed will be displayed on the chart.
'Date': Select the date to be displayed or hidden.
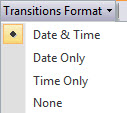
Transitions Format:
-
Date & Time: Selected by default, displays the last date and time of the replication.
-
Date Only: Displays the last date of the replication.
-
Time Only: Displays the last time of the replication.
-
None: Transition nodes will display no information.
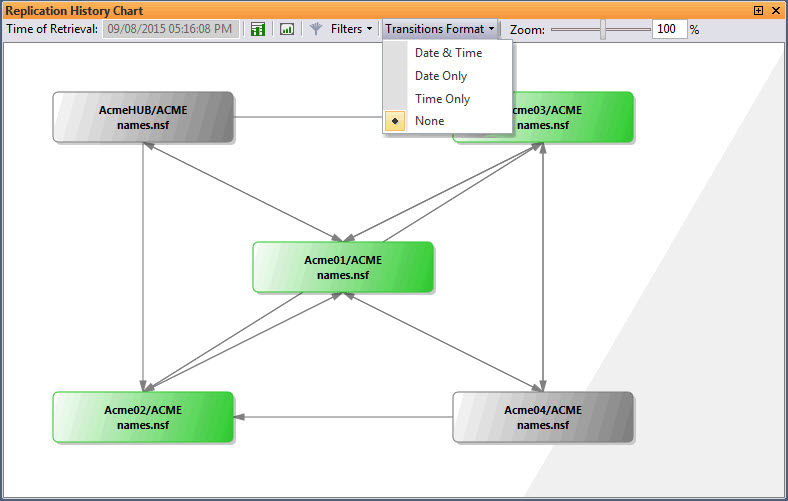
Zoom: For a better overview or finer detail, you can zoom on the chart from 1% to 1000%.
The Colors Used in the Replication History Chart
The database and transition nodes in the Replication History Chart use the following color coding in order to provide more information:
Database Node Colors
|
Color |
Description |
|
|
Indicates a server is currently loaded in the back-end of the application. |
|
|
Indicates that a server is NOT currently loaded in the back-end of the application. |
|
|
Indicates that a server is currently loaded in the back-end of the application but is part of the Excluded Server List. |


Transition Node Text Colors
|
Color |
Description |
|
|
Default color for transition nodes. |
|
|
Indicates if the date shown in the transition is more than a month old. |