The GridView offers a range of options to make your data easy to navigate, analyze and report.
NEW - The Data Viewer lets you view and manage all your property columns conveniently in one place.
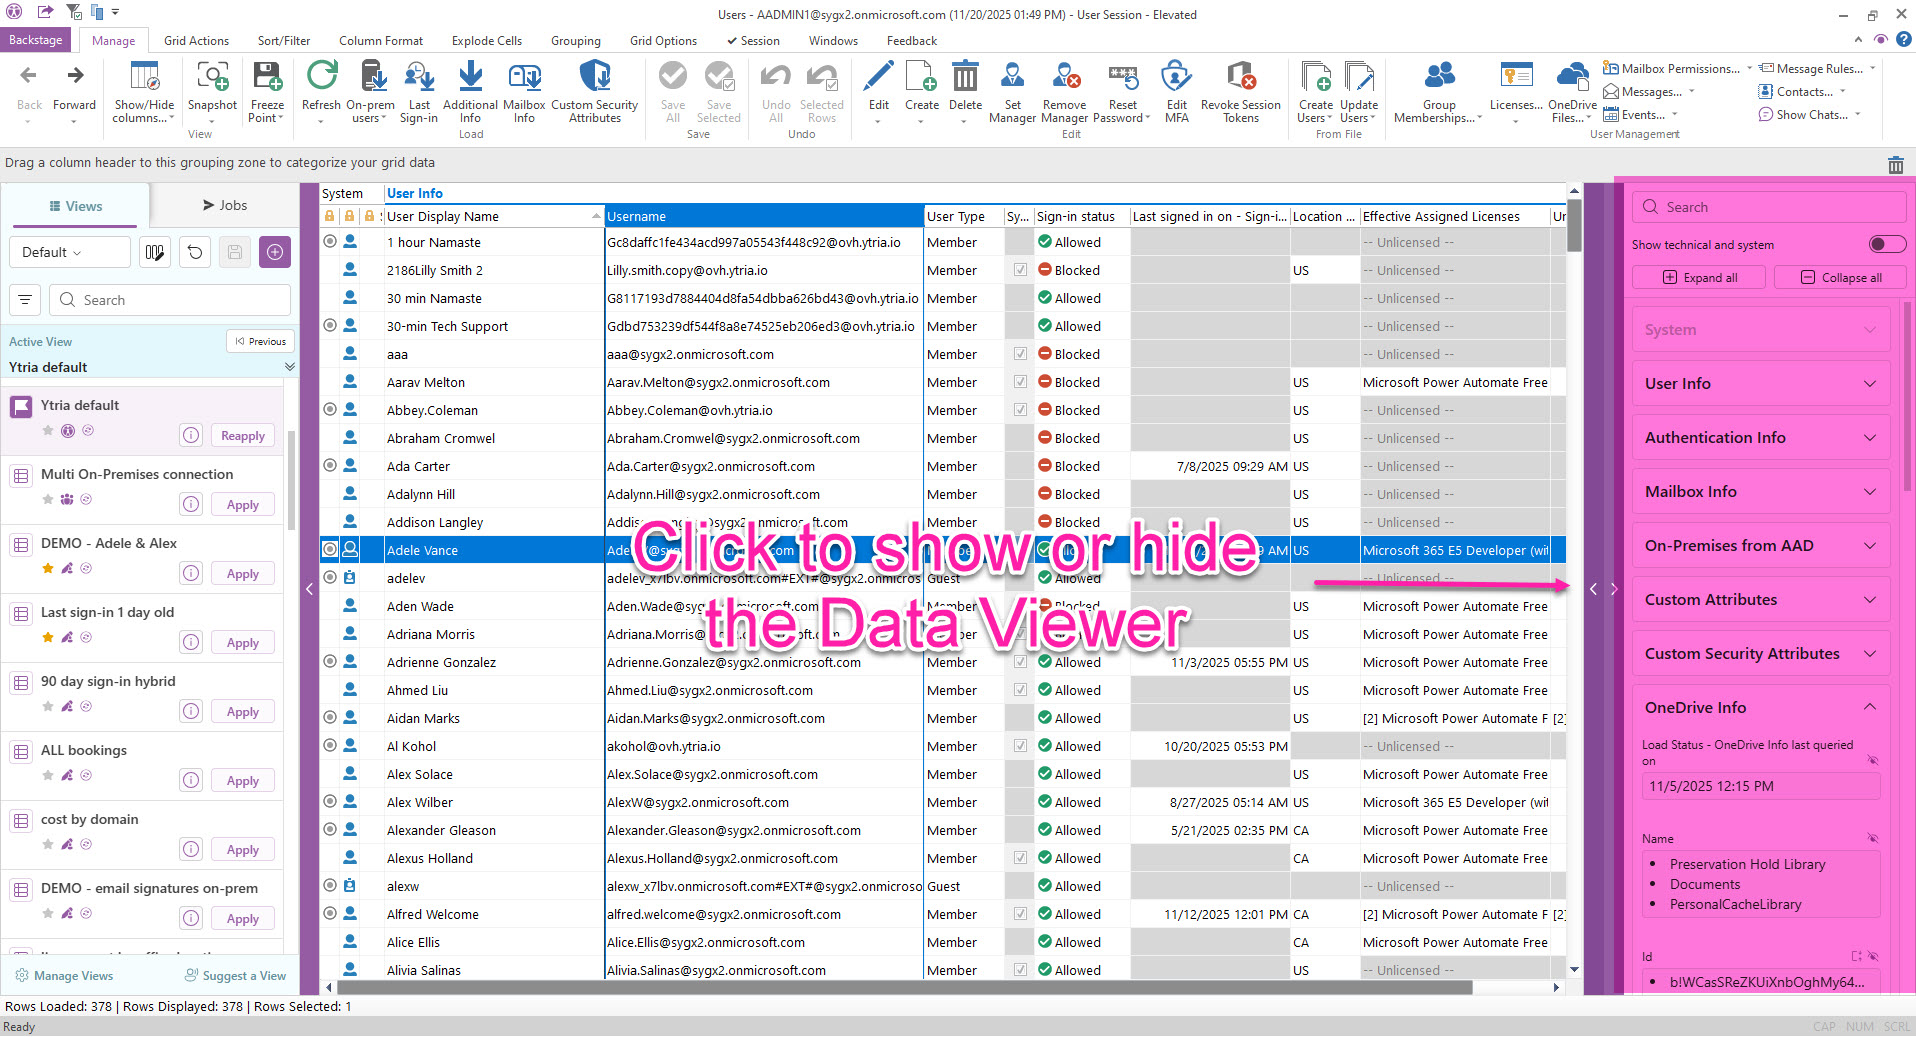
Get more details on how to:
You can also:
Filter, sort & group
The Sort/ Filter tab provides various options for this:
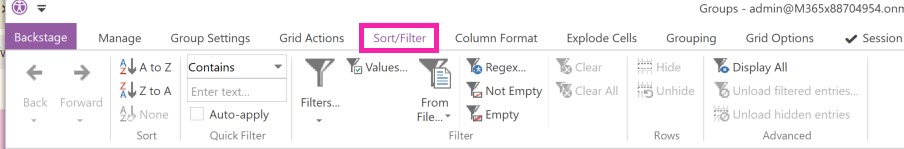
Alphabetical sorting and a quick filter are readily available. Extensive filter options are also provided for values, regular expression, text, number, date, time, cutoff date/time, etc... Also provided are options to exclude empty cells, clear filters and hide selected rows.
Grouping
Grouping is a special feature of the GridView that allows you to categorize the entire grid by any property on the fly.
Simply drag any column headers up into the grouping zone.
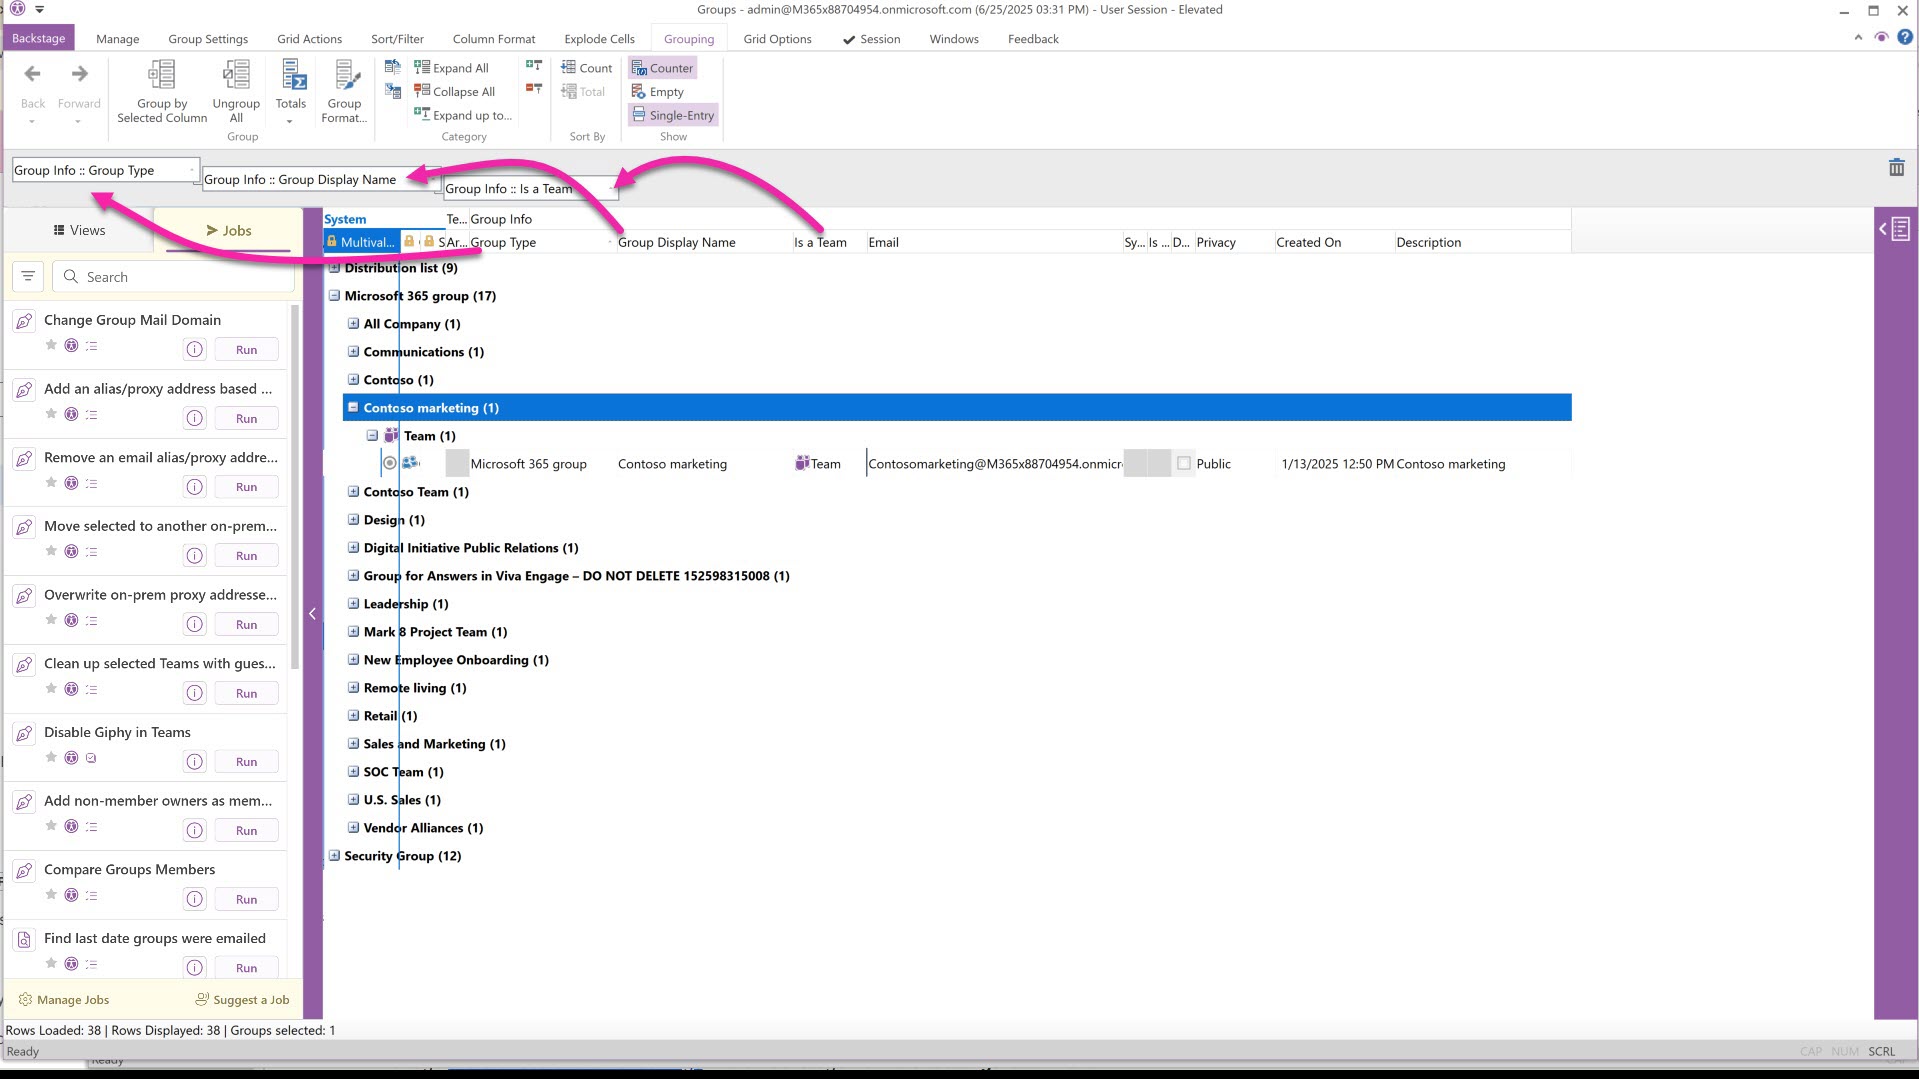
In this example, we can see all groups by type, their group name, and finally, which are Teams.
We can also see how many items are within each category.
You can do this with as many sub-levels as you like and reorder them as needed. For example, you could first show each department and all usernames within. Then instantly flip that to check which usernames appear in more than one department.
If you are searching for a string in a grid with categorizations using the 'Find' feature, make sure to expand all groupings first.
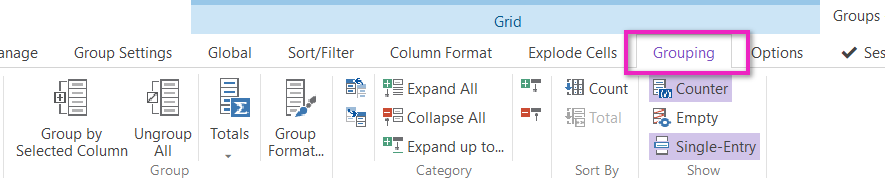
The Grouping tab
Furthermore, the grouping headers can be set to display totals or other relevant results.
The grouping tab provides buttons for these settings, including:
-
Group format - options to change the way that values are displayed in all group header rows
-
Totals - how each category header displays totals as well as the type. Examples are Sum, Average, Count, Count but exclude empty cells, etc..
Export or copy/paste
There are many ways to export and report what is displayed in sapio365.
Copy/ Paste:
First, anything displayed can be simply copied & pasted to another program. Since this is rich text, anything you copy will be pasted as-is.
This means you can set up a custom display of groupings and expanded or collapsed headers and copy this as-is to your external program.
Export:
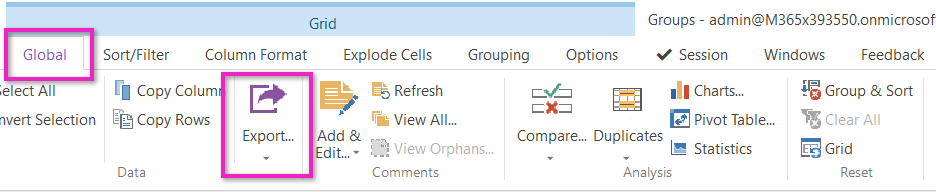
Export the grid's content to various file formats.
This option is grid-specific and will only include the selected data of the grid within which the export is initiated.
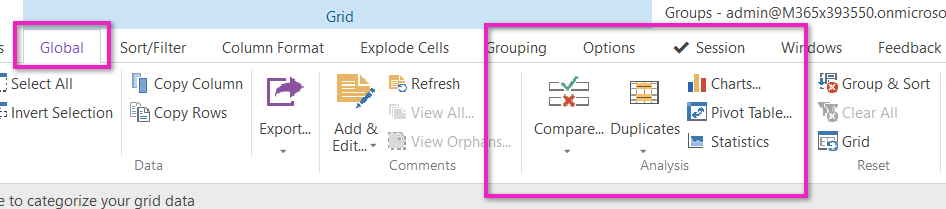
Analysis tools
The Global tab provides a range of tools for more advanced analysis, such as charting, pivot tables, finding duplicates, comparison and statistical operations.
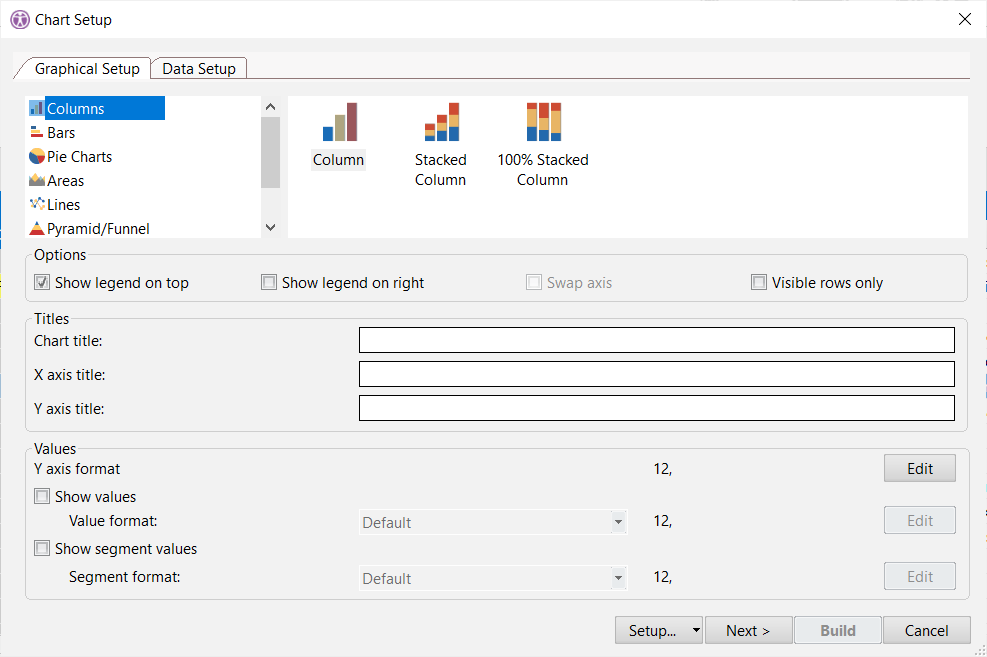
Charts
Build summarized reports of the data in your current grid.
Choose among various chart types and display options, including pie, bar and line graphs.
Pivot
Build a pivot table from the data displayed in your current grid
Compare Column Values
Identify which items match, which do not, and which are missing by comparing cell values of multiple entries in the grid.
Show Duplicates
Shows the number of times identical values occur in a selected column, and per category.
Example: The number of times the same department name appears within each country.
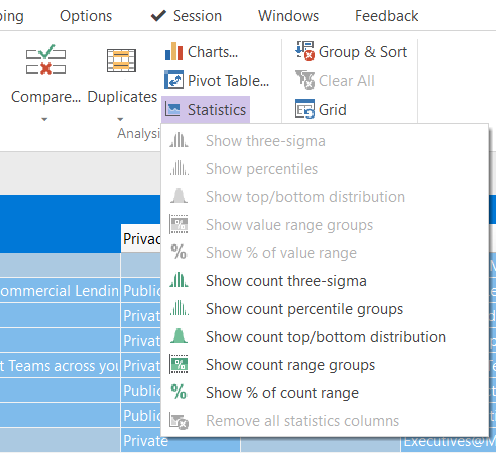
Statistics
Perform a variety of statistical calculations for a data set defined by your currently focused column.