Log Analyzers in consoleEZ
consoleEZ Log Analyzers
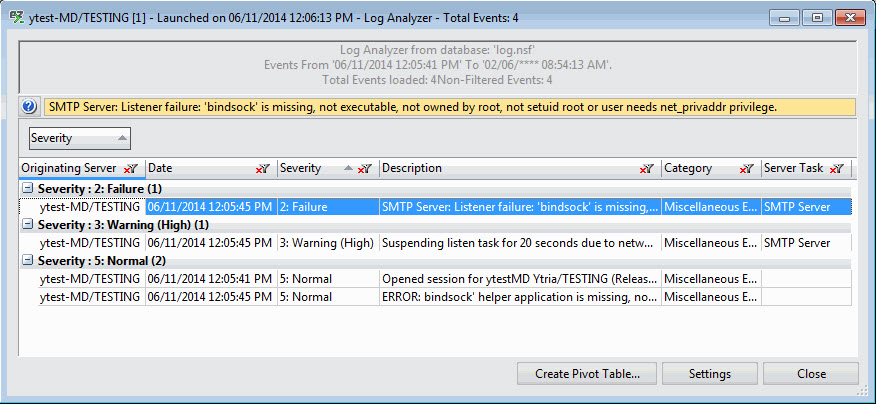
The Log Analyzers in consoleEZ provide you with the Ytria flexYgrid interface to help analyze and monitor your Domino logs.
The Log Analyzer scans the 'Events' categories (including passthru connections) from the server's log.nsf and displays the errors.
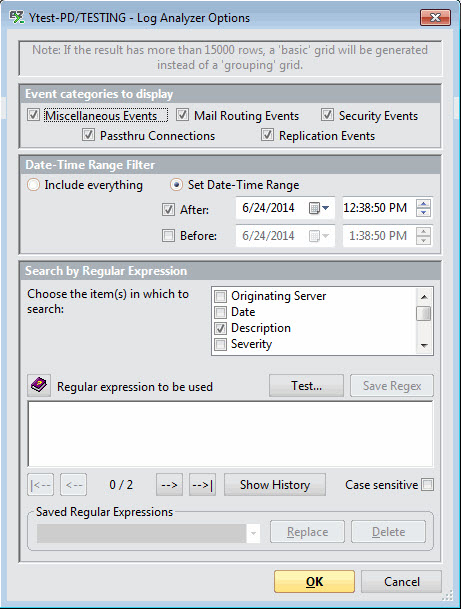
consoleEZ Log Analyzers Options

- Events categories to display
Miscellaneous Events: Events that do not appear in other views.
Mail Routing Events: Mail routing details, not available in the Miscellaneous Events view.
Security Events: For example, ID Vault events.
Passthru Connections: Activity of users or servers connecting through a Domino pass-through connection.
Replication Events: Information about servers replications.
- Date-Time Range Filter
Include everything: Include all the logs, no time range applied.
Set Date-Time Range: By default it takes 30 minutes before the last log time.
- Search by Regular Expression
More information about Regular Expression on this page.
Using Log Analyzers
- Create Pivot Table: You can create a Pivot Table with the grid data values. More information about Pivot Table on this page.
- Settings: Display the Log Analyzer Options from the Log Analyzer grid.
- Close: Close the Log Analyzer grid.
Grid right-click options - Tools and Columns
More information about Grid Tools and Options is here.
The Log Analyzers Grid includes the following columns:
| Originating Server | Source log server. |
| Date | Date and Time value. |
| Description | Log description. |
| Severity | Log event severity. |
| Category | Log event category. |
| Type Code | Decimal format value. |
| Status Code | Hexadecimal format value. |
| Server Task | Server Task name. |
| Target Server | Target Domino Server. |
| Target Database | Target Domino Database. |
| Target User | Target Domino User. |
| Target Extra | Target Extra data. |
More information about Grid Columns is here.
