The gateway to all your data in sapio365
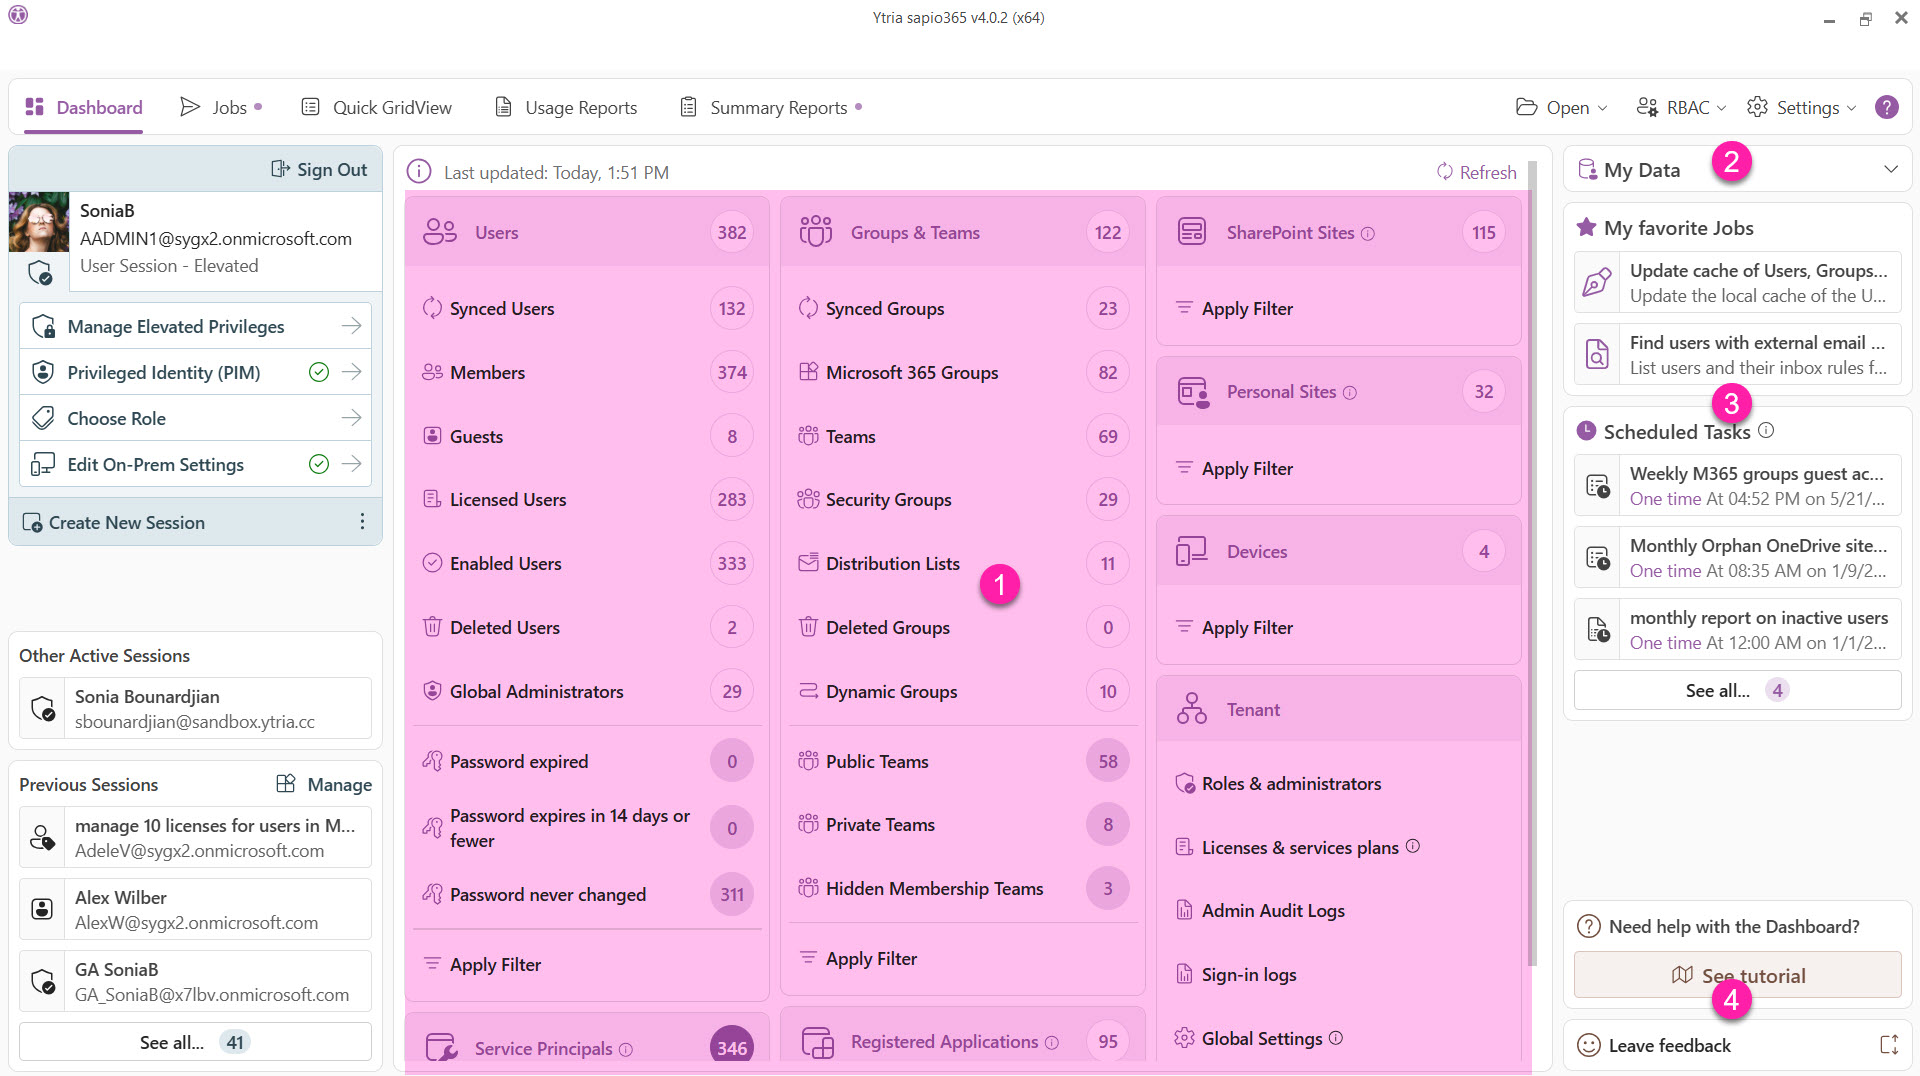
The Dashboard in the main window of sapio365 serves as a collection of entry points to your data in Entra. You’ll also see object counts for these that are also available in Business Reports.
Counts and filters
-
Certain counts (darker circle) are computed from cached data and are only available after the data has been loaded and written to the local cache. For example, the password-related counts under ‘Users’, and Public/Private Teams under ‘Groups & Teams’.
-
Some sections have pre-filtered entry points (ex. Guests), and a filter option ‘Apply Filter’ based on a custom criteria.
-
Click on these data entry points to retrieve them and their properties, and show them in a sapio365 GridView where you can manage them.
-
Users: User accounts including members, guests, service accounts, rooms, shared mailboxes, and equipment.
-
Deleted Users: Restore users that were deleted in the last 30 days, or permanently delete them.
-
-
Groups & Teams: M365 groups and Teams, security groups and distribution groups.
-
Deleted Groups: Restore security groups and Microsoft 365 groups that were deleted in the last 30 days, or permanently delete them.
-
-
SharePoint Sites: SharePoint Online sites including sites associated to Teams, M365 groups, private or shared channels.
-
Personal Sites (available only in an Elevated or App session): OneDrive sites of existing users and orphaned OneDrives.
-
Devices: Registered devices and their owners or users.
-
Tenant:
-
Roles & Administrators: Admin roles and the users or service principals that have been assigned these roles.
-
Licenses & Service Plans: Purchased Microsoft 365 licenses and service plans, and the option to set a unit cost for each.
-
Global Settings: Tenant-wide settings that you can activate and set for user passwords and policies.
-
Sign-in Logs: Logged event list for all Microsoft 365 sign-in attempts.
-
Admin Audit Logs: Logged events of admin actions in Entra.
-
-
Service Principals: Service Principal associated to a registered application or an enterprise application.
-
Registered Applications: Registered applications in Entra.
-
-
Access and manage your own personal emails, groups and more from ‘My Data’.
-
See a list of your favorite jobs and scheduled tasks.
-
Watch a short video about “The Dashboard” (see top of page) or send feedback on your sapio365 experience.